 Atlas
AtlasAtlas field guide
One live chart that shows where dealer positioning, options flow and dark-pool levels line up with price, so you can see your levels before price gets there.


Why it matters
Most charts show you price and leave the options market somewhere else. Atlas puts them together. It answers one question: where do price, dealer positioning and real options activity line up right now?
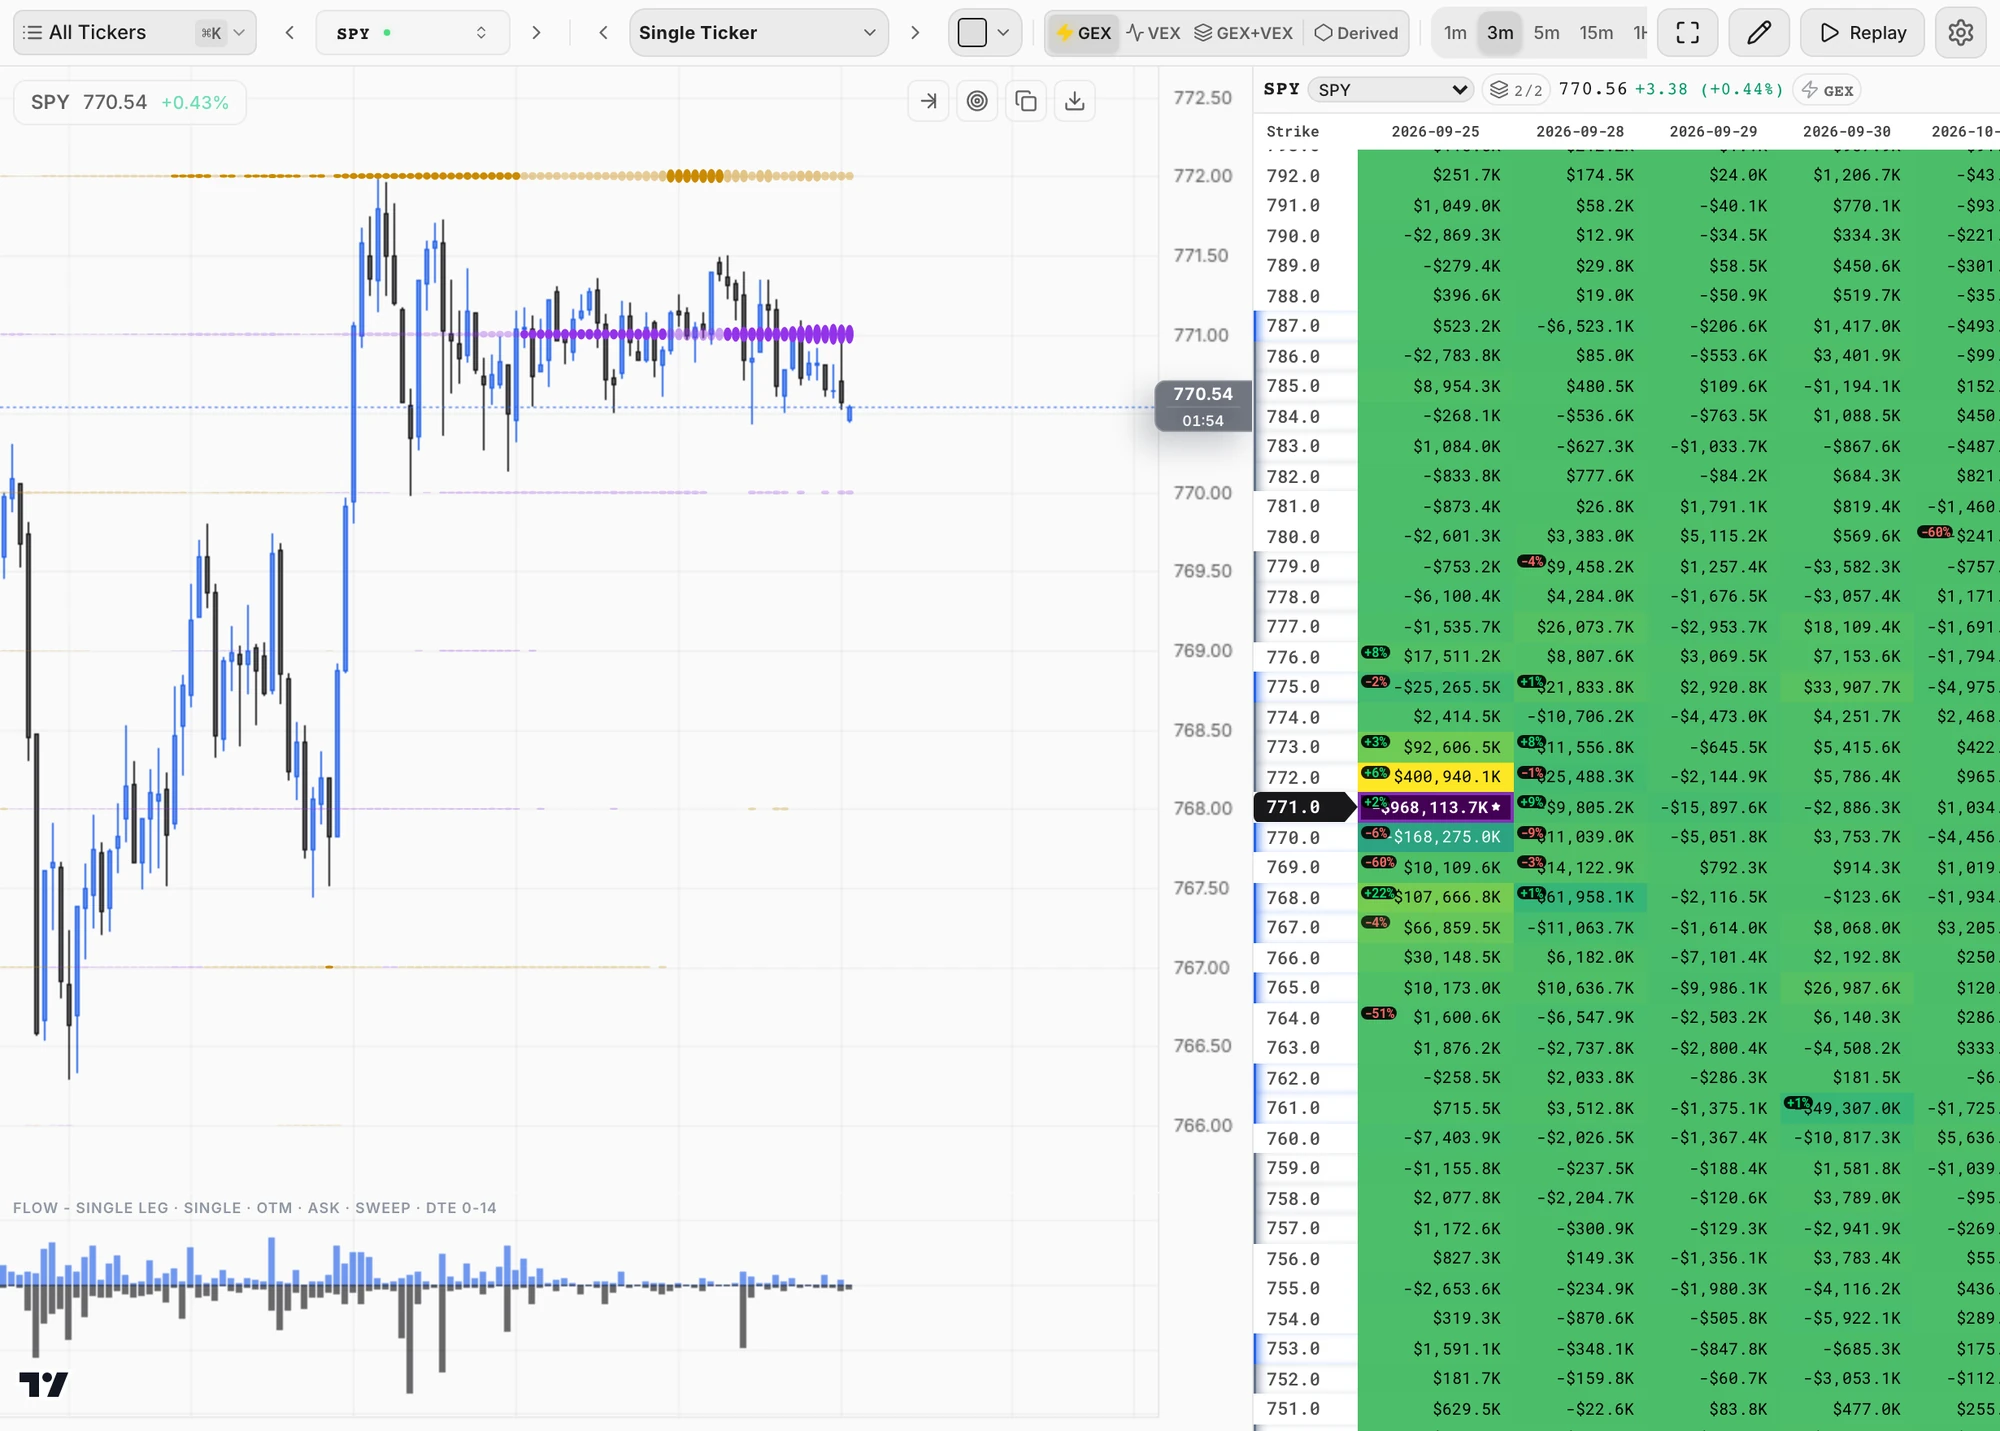
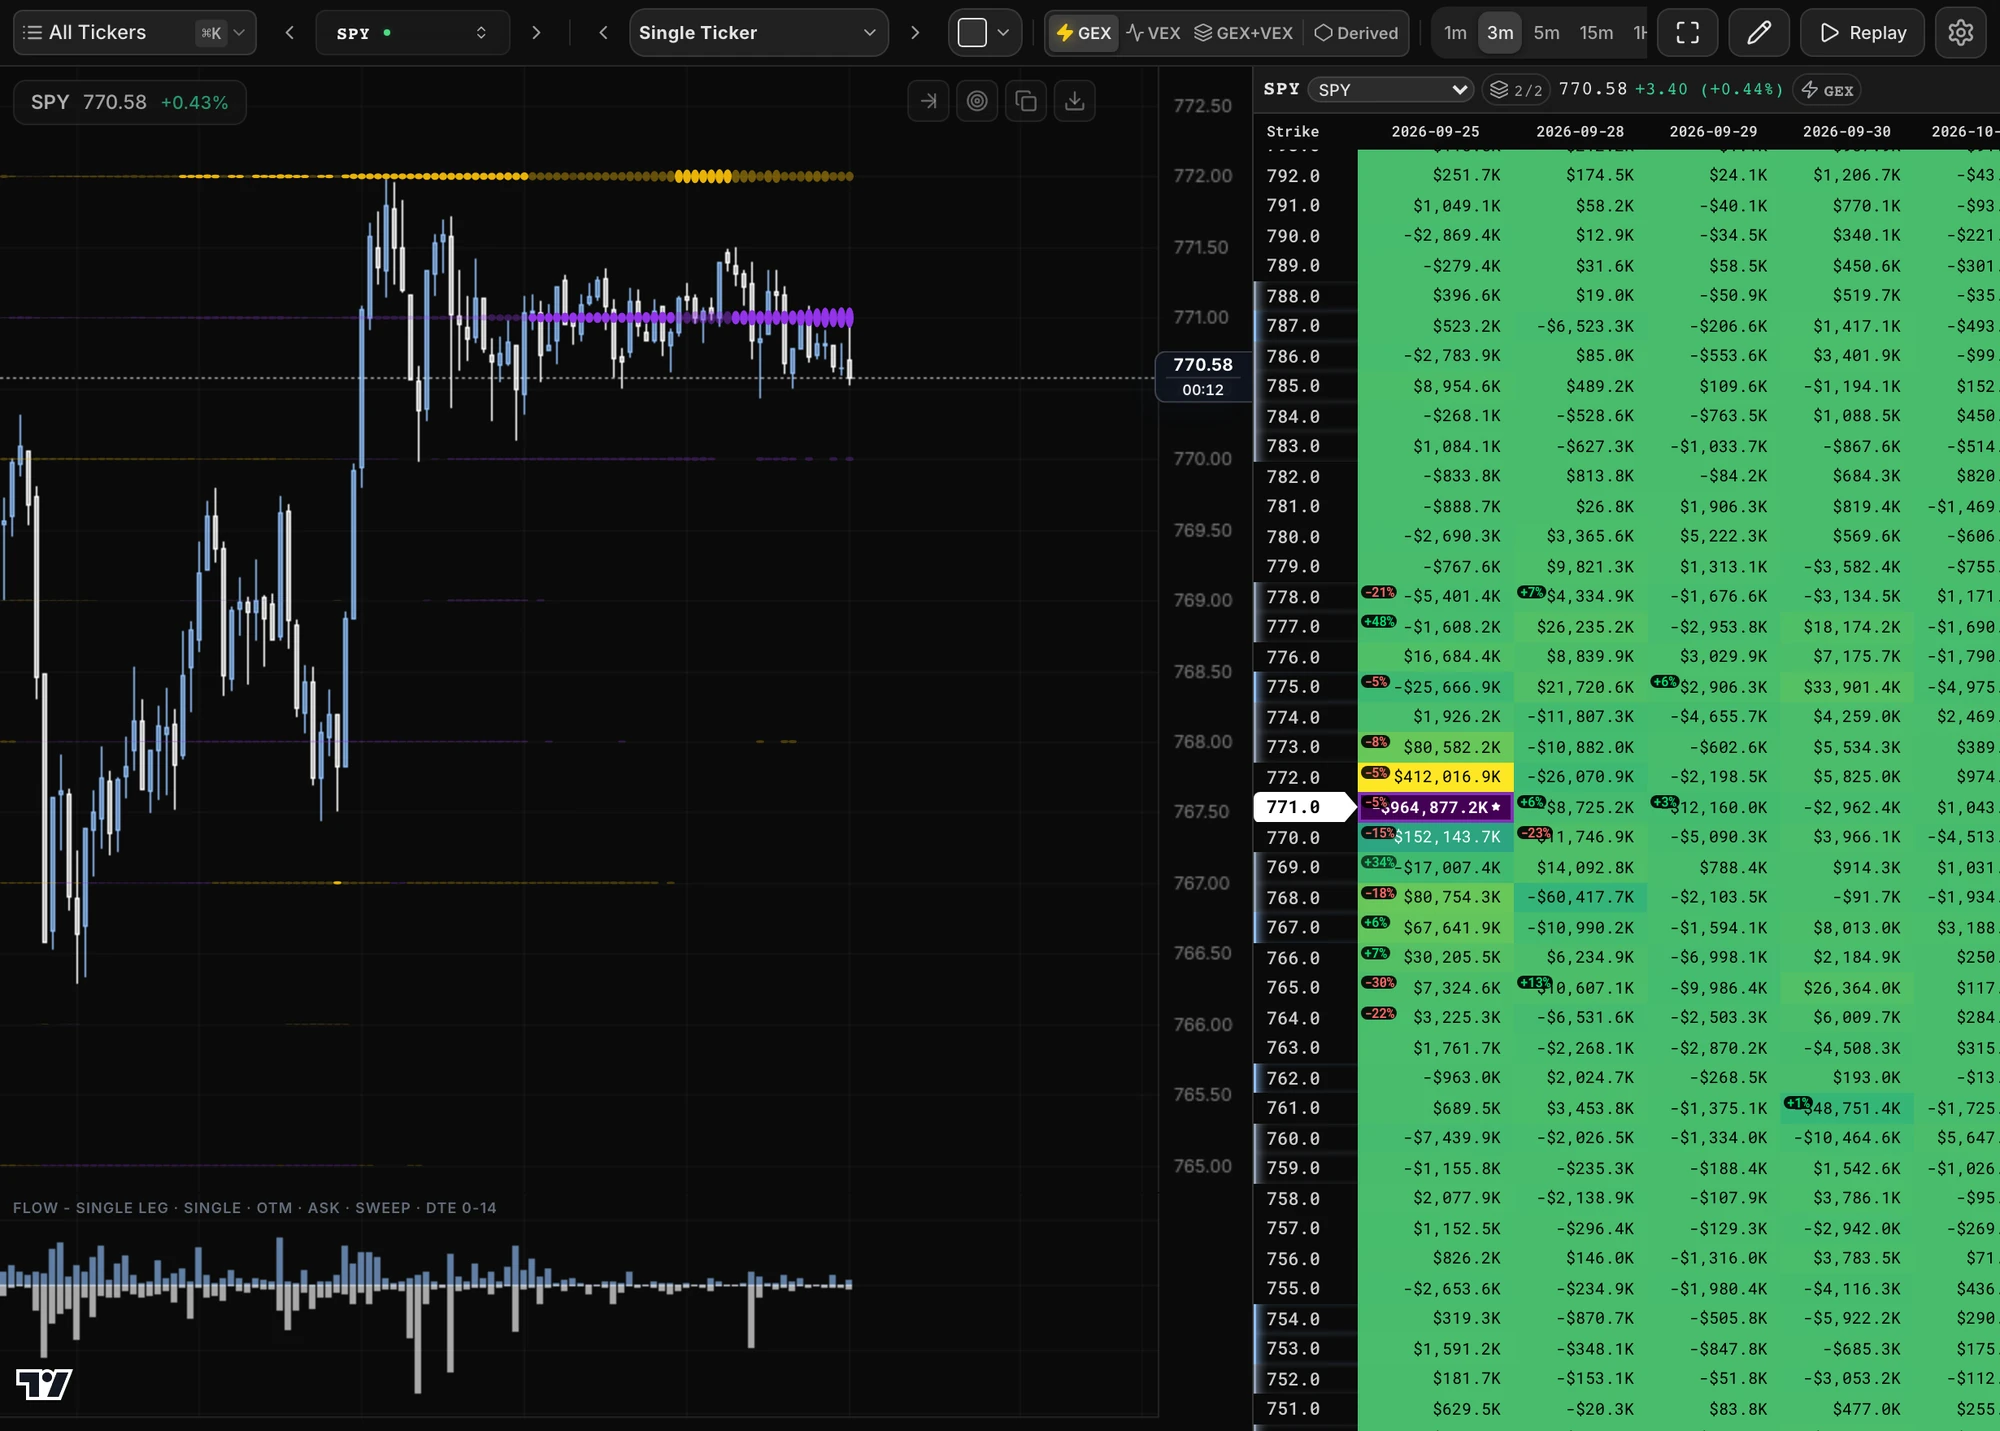
Atlas is Skylit's own chart, inside the Skylit app. On one screen you get:
| Layer | Comes from | What you see on the chart |
|---|---|---|
| Orbs | Heatseeker | Circles at the strikes where dealer positioning is concentrated, bar by bar. Each of those strikes is a node. Bigger and brighter means stronger. The strongest is the King Node. |
| Heatmap and Trinity sidecars | Heatseeker | Panels docked beside the chart (sidecars). Heatmap shows the strike-by-expiration heatmap for your symbol. Trinity shows several symbols' heatmaps side by side. |
| Flow | Flowseeker | A pane of call premium (up) and put premium (down) for each candle. Click a bar to see the trades behind it. |
| Dark Pool | Flowseeker | The largest recent dark-pool print levels as horizontal lines. |
| Price studies | Atlas | VWAP, CVD, Volume, Volume Profile, TPO, Footprint and the usual moving averages, built from the trade tape. |
| Your things | You | Price alerts, drawings, watchlists, saved layouts, and your positions if you trade on Nexus. |
Atlas never calls a direction. An orb tells you how price tends to move through a level (slowed down or sped up), not which way it will go. The thesis is yours.
Where to find it
Atlas comes with the Pro plan. On other plans the page shows "Available to Pro Tier only".
- Open it: in the left menu, pick ATLAS. It is also listed under HEATSEEKER, so the heatmap and the chart are one tap apart. The same entries are in the phone menu.
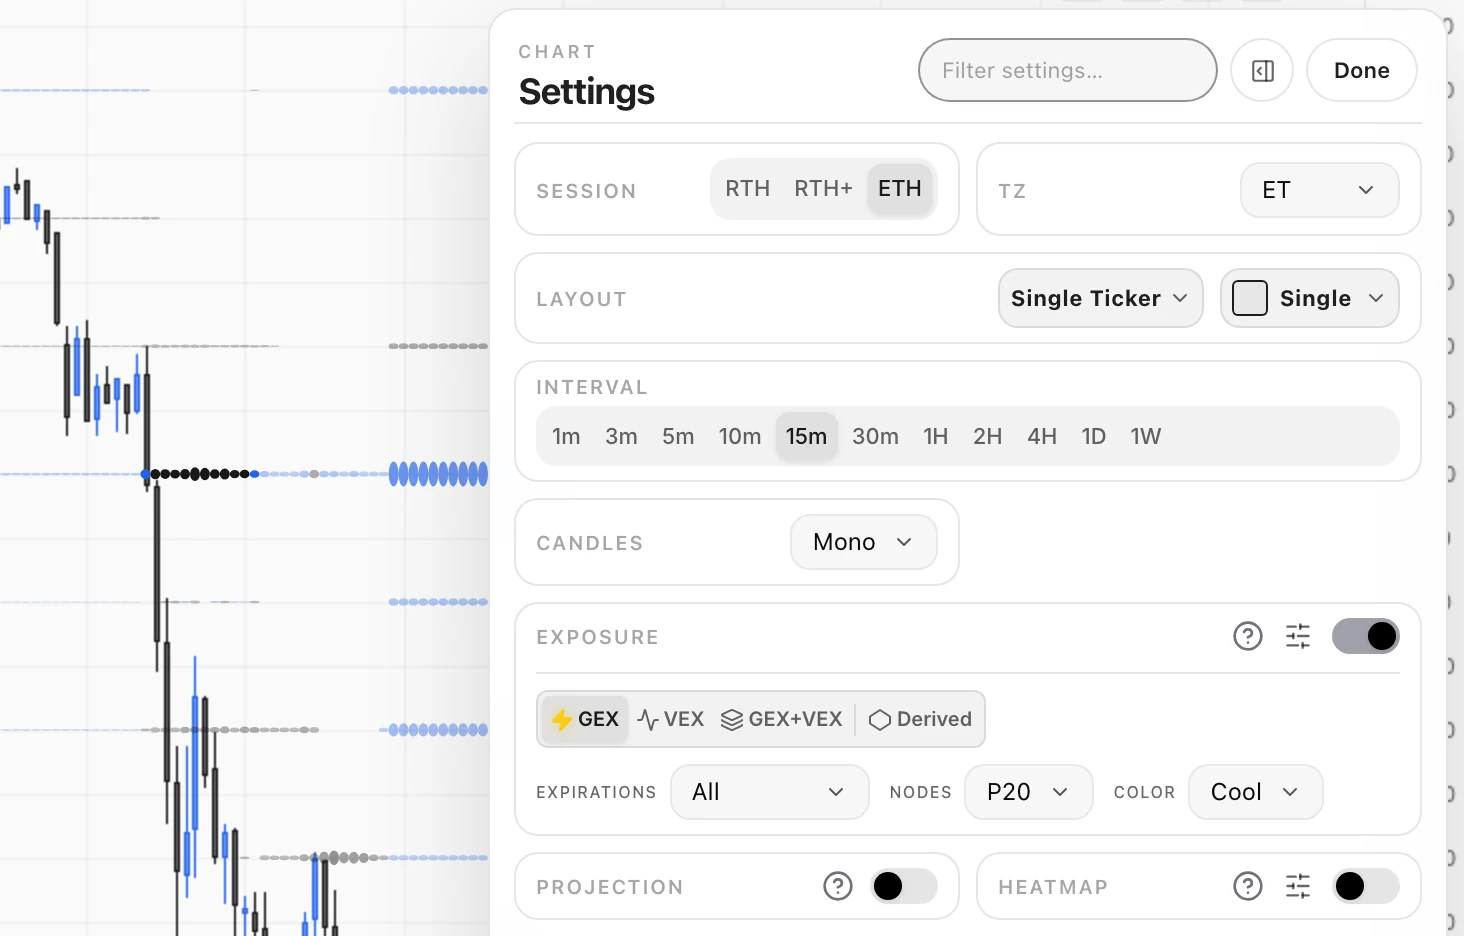
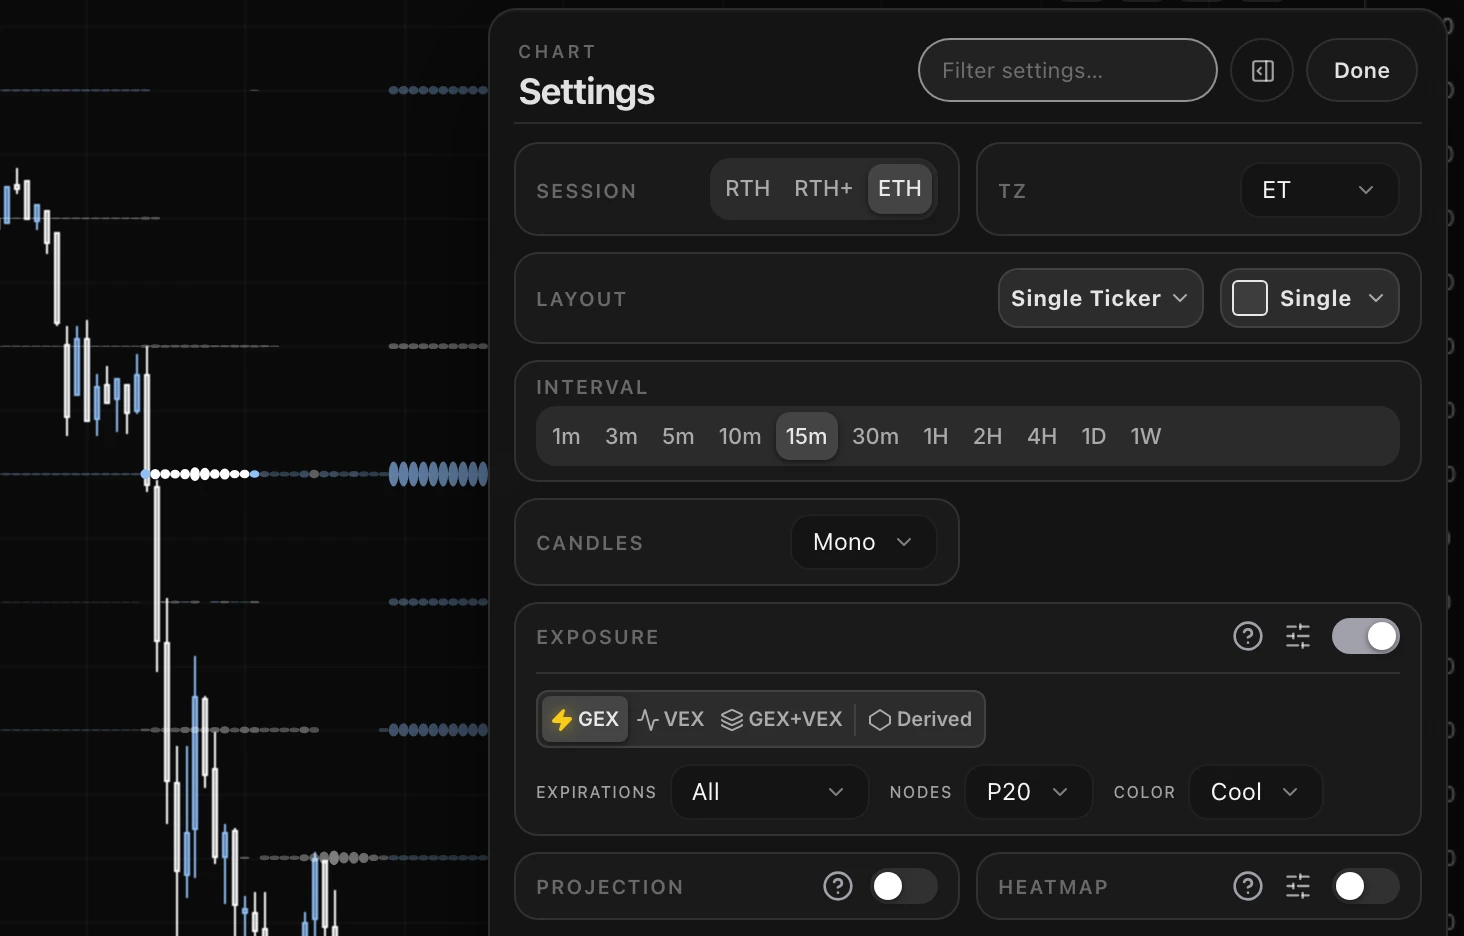
- Almost everything else is in Settings: press Shift+S, or click the cog at the right end of the chart header. It holds the Exposure, Projection, indicator, sidecar and alert cards.
| You want | Go to |
|---|---|
| Orb settings | Settings (Shift+S) > Exposure |
| Add an indicator, Flow or Dark Pool | Settings > Add |
| Heatmap or Trinity beside the chart | Settings > Heatmap / Trinity, or Shift+H / Shift+T |
| Price alerts | Settings > Alerts (Shift+A), Alert Lines |
| Saved workspaces | Layout switcher in the chart header, or [ and ] |
| Past sessions | Replay (Shift+R) |
| Every keyboard shortcut | Press ? |
| Product docs | docs.skylit.ai > Atlas (drawing presets, indicator pages) |
| Price data by API | docs.skylit.ai > Atlas > API Reference (paid with Skylit API credits) |
| Articles | skylit.ai/learn/reading-flow-on-atlas · skylit.ai/learn/reading-dark-pool-prints |
| Report a bug or ask for a feature | app.skylit.ai/portal |
Read it in 30 seconds
- Pick your horizon. In Settings > Exposure, set Expirations to match how long you hold. Use Front for 0DTE (same-day expiry) and scalps. Use a wider window such as To Friday or To OPEX (the monthly options expiration) for swings. The orbs change with it. The price chart does not.
- Find the King Node and the nearest nodes above and below price. Many traders treat these as the levels to watch (a rule of thumb, not a tested signal). Turn on Node labels to see each node's strike and its size as a percent of the king.
- Pick the exposure view. GEX (gamma exposure) tracks how dealer hedging reacts to price. VEX (vanna exposure) tracks how it reacts to volatility. A common rule of thumb: GEX for intraday support and resistance, VEX for multi-day bias, GEX+VEX to see both.
- Look for confluence. Confluence means several independent reasons at one price. Traders usually rate a node higher when it sits on a dark-pool level, a VWAP band or a cluster of flow bars.
- Watch what price does there. The chart shows where the levels are. Price action shows what happens when price arrives.
How to use it
Set up the chart
Why: the right symbol, timeframe and session make every other layer easier to read. Where: the header along the top of the chart, and the first cards in Settings (Shift+S).
- Type a ticker in symbol search at the top left. You can chart stocks, ETFs, SPXW (the S&P 500 index options symbol) and futures continuous contracts such as ES1 and NQ1. With a watchlist open, the left and right arrow keys step through its symbols.
- Pick an interval: 1m, 3m, 5m, 10m, 15m, 30m, 1H, 2H, 4H, 1D or 1W. You can also add your own, such as 7m or 90m. The strip shows your pinned set: right-click an interval to drop it, press + to add one back.
- In Settings, pick a Session: RTH (regular trading hours only) or ETH (extended hours, including pre-market and after-hours).
- Also in Settings, pick your timezone (TZ) and a Candles style (Classic, Mono, Neon, Ocean or White).
Also worth knowing:
- Fullscreen (Shift+F) is in the header.
- Copy image and Save image sit in each chart's own small button row, for sharing a chart. On a narrow chart they fold into a menu there.
Panes and layouts
Why: watch several symbols or timeframes at once, and come back to the same workspace every day. Where: Pane layout and the layout switcher in the chart header.
- Open Pane layout and pick an arrangement: Single, 2-Up, 2-Stack, 3-Up, 1 + 2, 4-Grid and more, up to five panes. Phones use the stacked arrangements.
- Click a pane to focus it, then set its symbol and interval.
- In the same Pane layout menu, the Sync row decides how changes spread. With Settings on, a settings change applies to every pane; off, only to the focused pane. Interval, Crosshair, Time and Price link the interval, the crosshair time, the visible time window and the price-axis scale across panes.
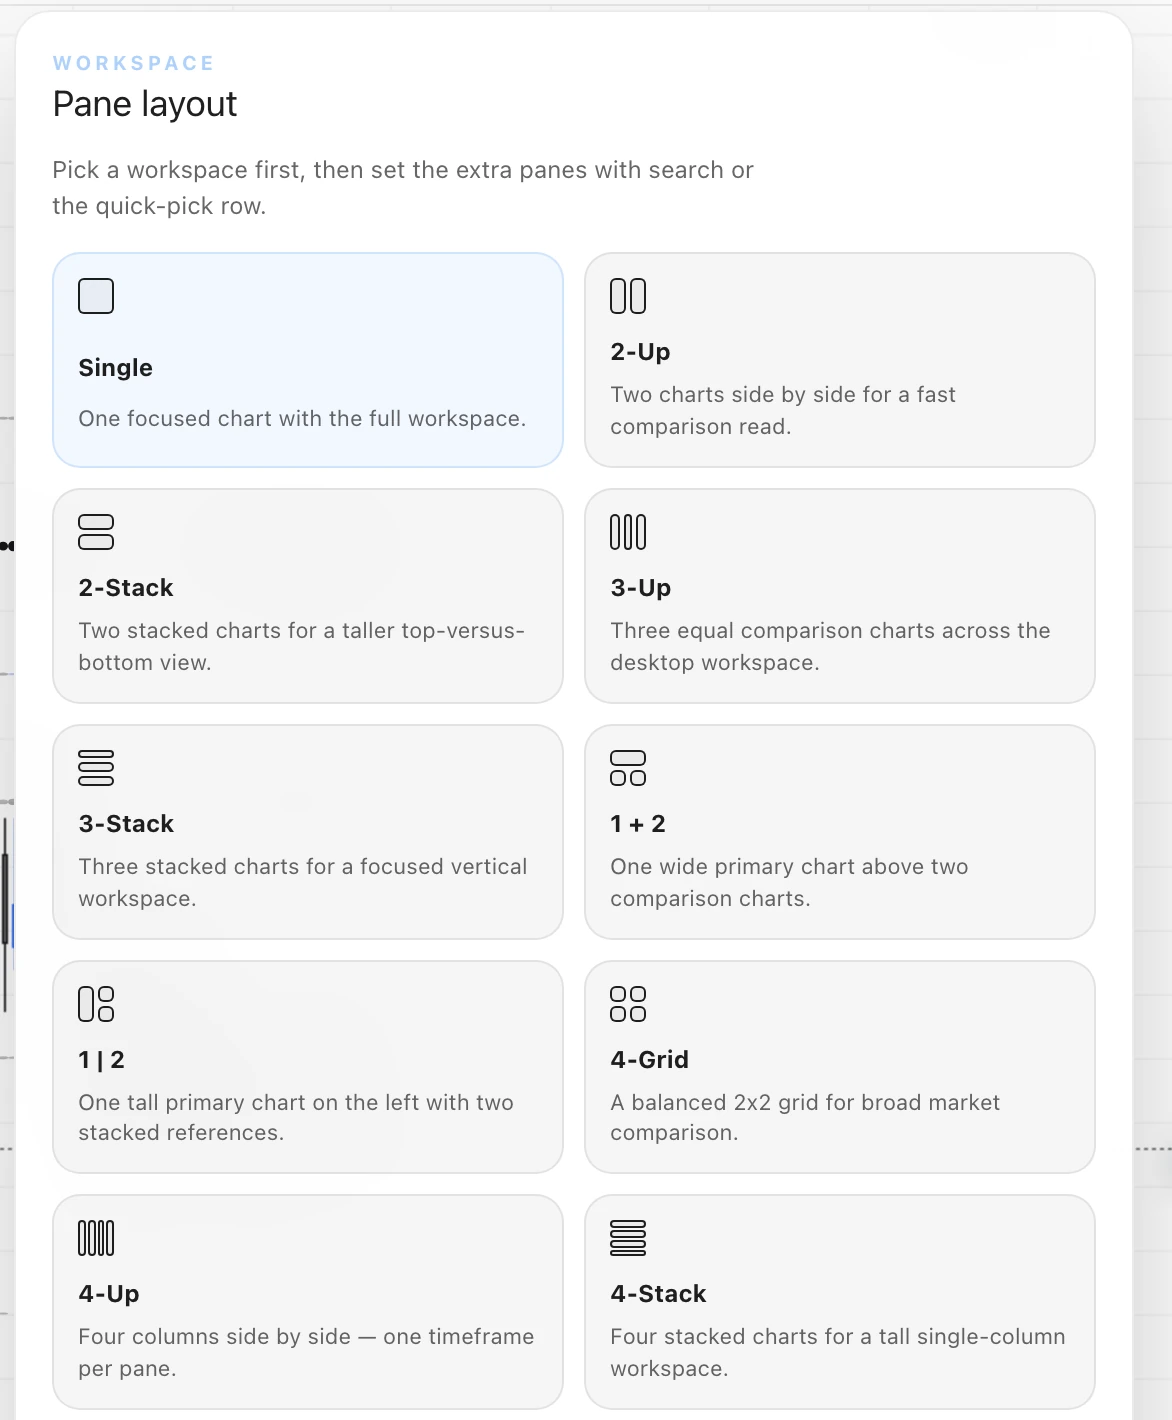
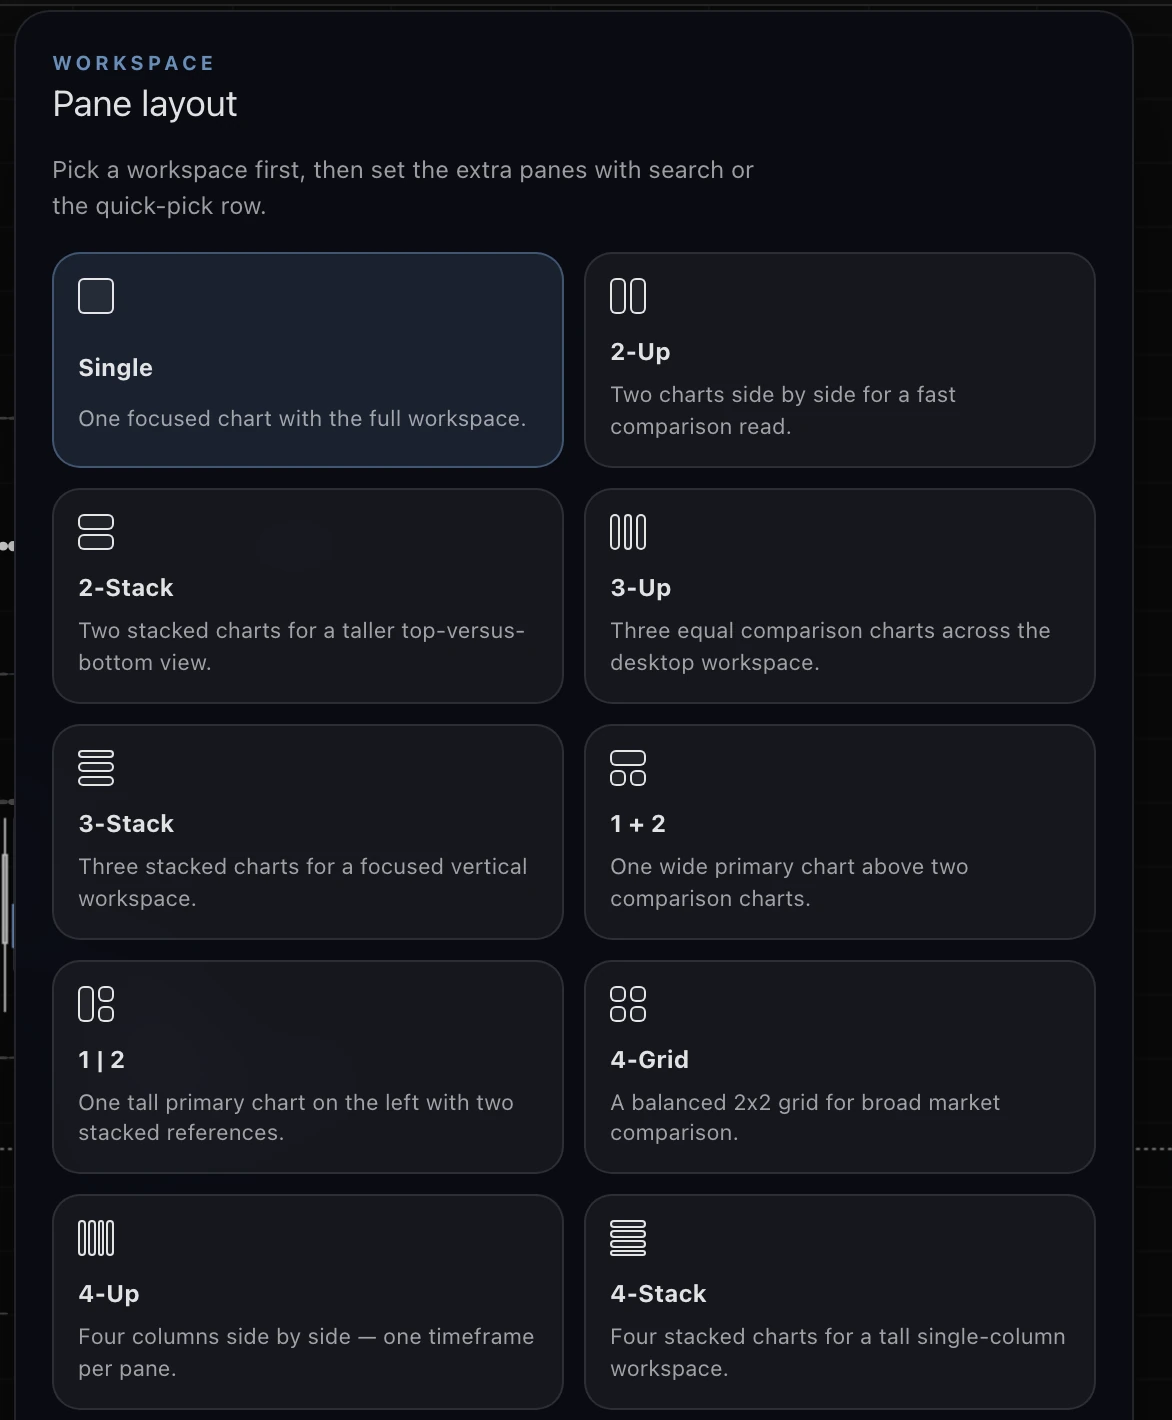
Layouts save the whole workspace: the arrangement, each pane's symbol, interval and overlays, and which sidecars are open. There is no Save button. Changes save a moment after you make them. Layouts belong to your account and follow you to other devices. Press [ and ] to cycle through them. You can also export a layout to a file and import it.
Dealer positioning: the orbs
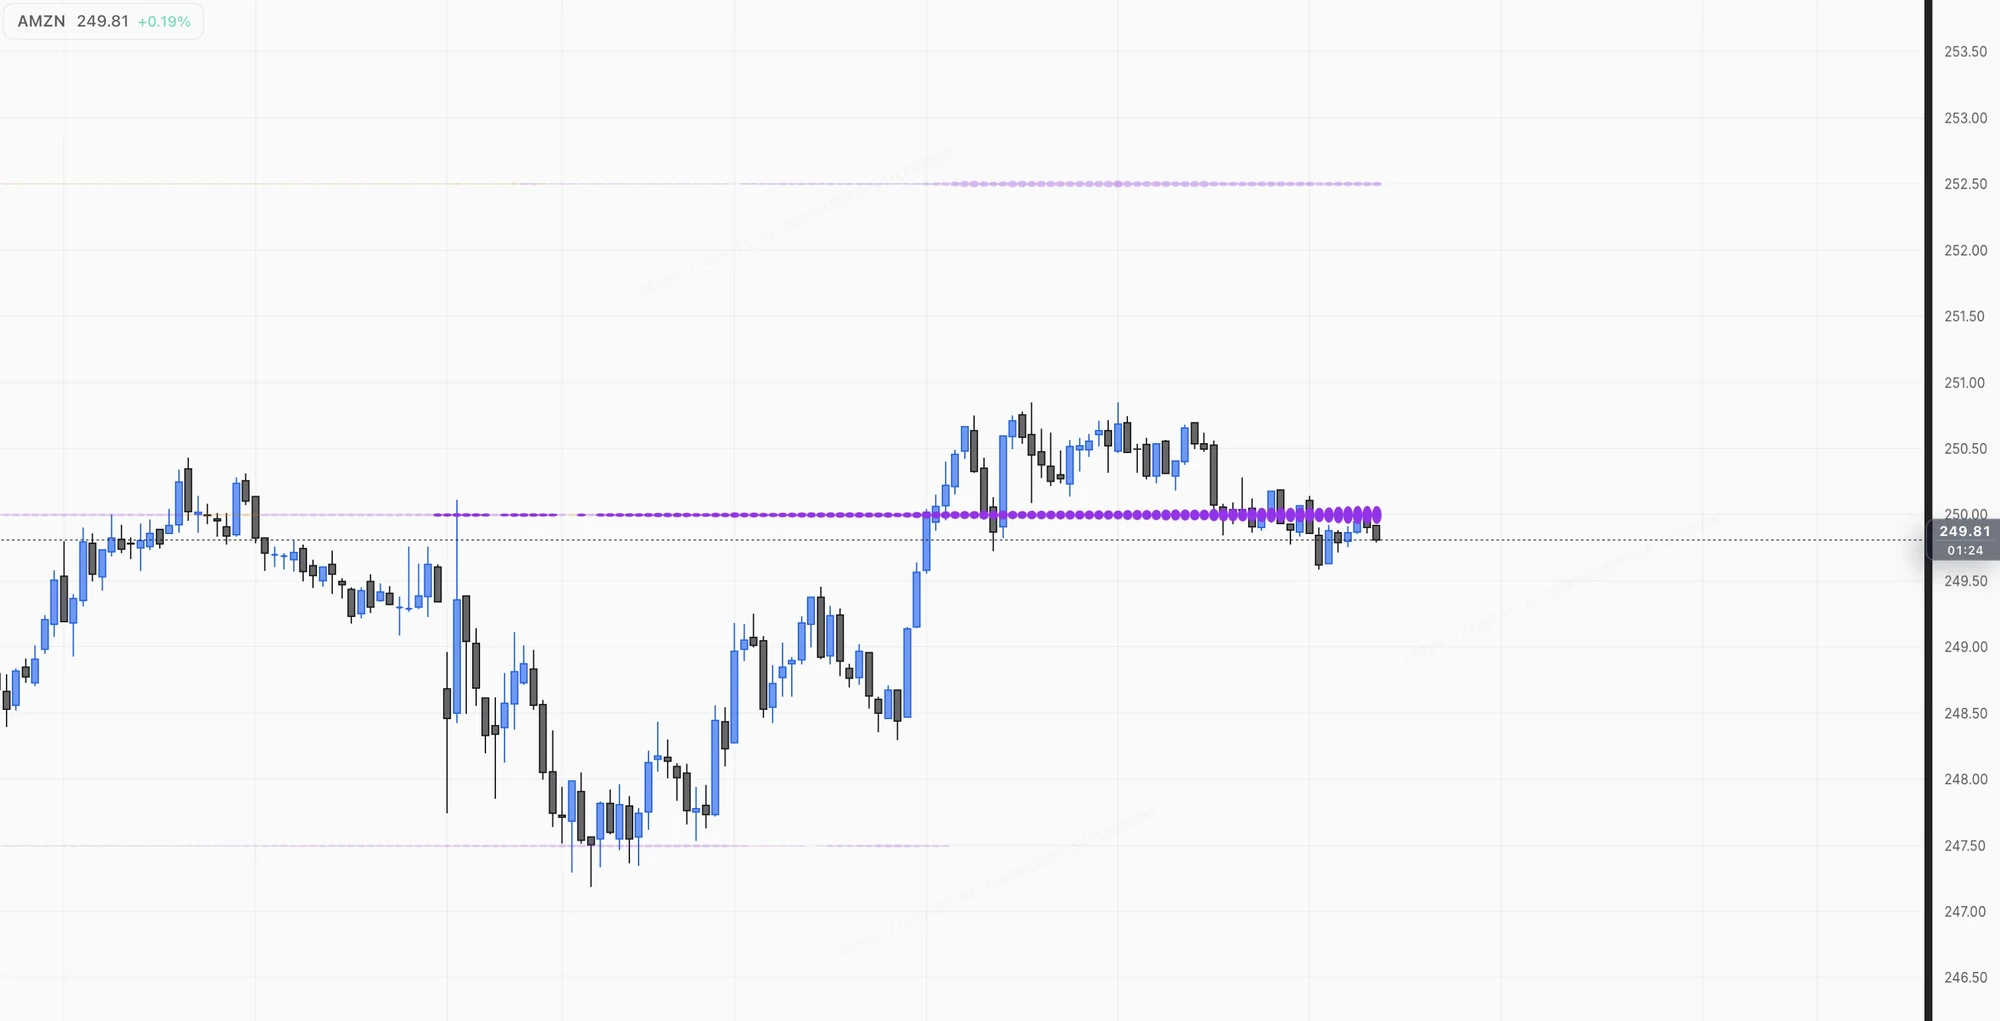
Why: see the strikes where dealer hedging is heaviest, drawn right where price is. That shows where a move may slow down or speed up. Where: Settings (Shift+S) > Exposure.
- Choose GEX, VEX or GEX+VEX (or press Shift+G, Shift+V, Shift+C).
- Set Expirations to your holding period.
- Set Nodes to control how many strikes are drawn per candle.
- Turn on Node labels if you want the strike and size printed next to the strongest nodes.
What each control does:
| Control | What it does |
|---|---|
| GEX / VEX / GEX+VEX | Which exposure the orbs draw. |
| Derived | Also draw exposure borrowed from related products: the S&P chains (SPY, SPXW, SPX) on ES and on each other, the Nasdaq chains (QQQ, NDXP, NDX) on NQ and on each other, and GLD, SLV, DIA and IWM on gold, silver, Dow and Russell futures. The Derived button also sits in the chart header next to GEX and VEX. With Distinct derived shapes on (the default), derived orbs draw as a diamond and triangles so you can tell them apart. Derived at latest ratio holds each derived strike on one horizontal line instead of letting it drift with the small price gap between the two products. |
| Expirations | Which expirations feed the orbs: Front (the nearest expiry), To Friday, To Next Friday, To OPEX, To Next OPEX, To Q-OPEX, To Next Q-OPEX, All, or an exact count of expirations (2, 3, 5, 7, 10, 15, 20, 30 or 50, front included). Hover an option to see what it covers and the date it ends on. |
| Nodes | How many strikes are drawn per candle: a fixed count (1, 3, 5, 10, 15 or 20), or a P-value (P15 to P60) that keeps every strike at least that percent of the King Node. |
| Color | Default, Warm, Cool or Mono. Match heatmap palette colors orbs exactly like the heatmap cells. |
| Orb size, clamps, opacities | How big and how bright orbs get, including a separate King Opacity so the King Node stands out. |
| Node labels | Label the strongest live nodes with strike and size as a percent of the king, pinned left, right, or just after the newest candle. With only GEX or only VEX selected, the strongest node shows its dollar exposure instead. |
| Realtime values | Keep orb sizes and labels updating live (Front expiration only, not with GEX+VEX). |
| Scroll as replay | When you scroll back, past orbs are sized only by what was known at that time, not by later bars. On by default. |
How to read it:
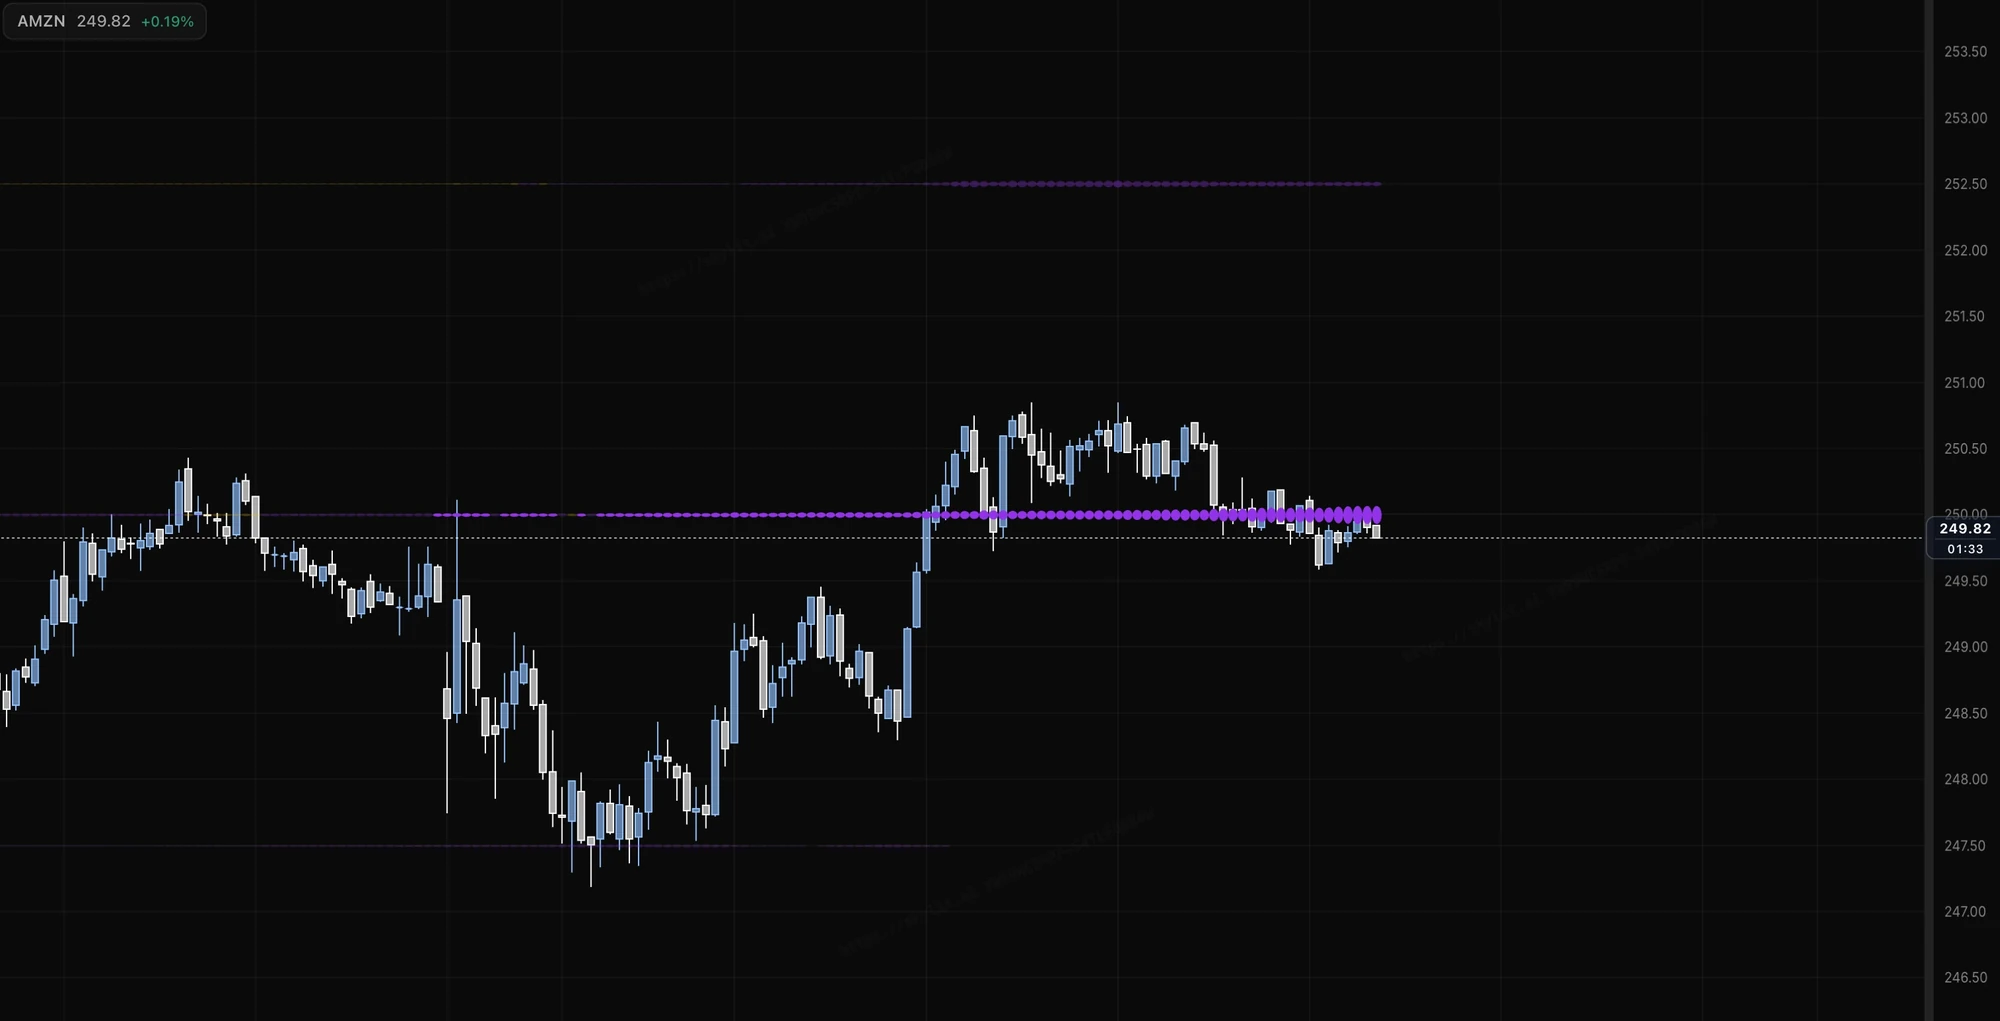
- Size and brightness: bigger, brighter orbs are stronger nodes. The King Node is the strongest on the board for your Expirations setting.
- Color (Default palette): yellow orbs are positive exposure and purple orbs are negative (with GEX+VEX, gold and orange). Strength shows in size and brightness, not in a different color. With Match heatmap palette on, orbs take the heatmap's color scale instead.
- Positive is not bullish. Around positive nodes price tends to slow down. Around negative nodes it tends to move faster. Either kind can act as support or resistance.
- Changing these settings changes which data is drawn, never the data itself.
Projection
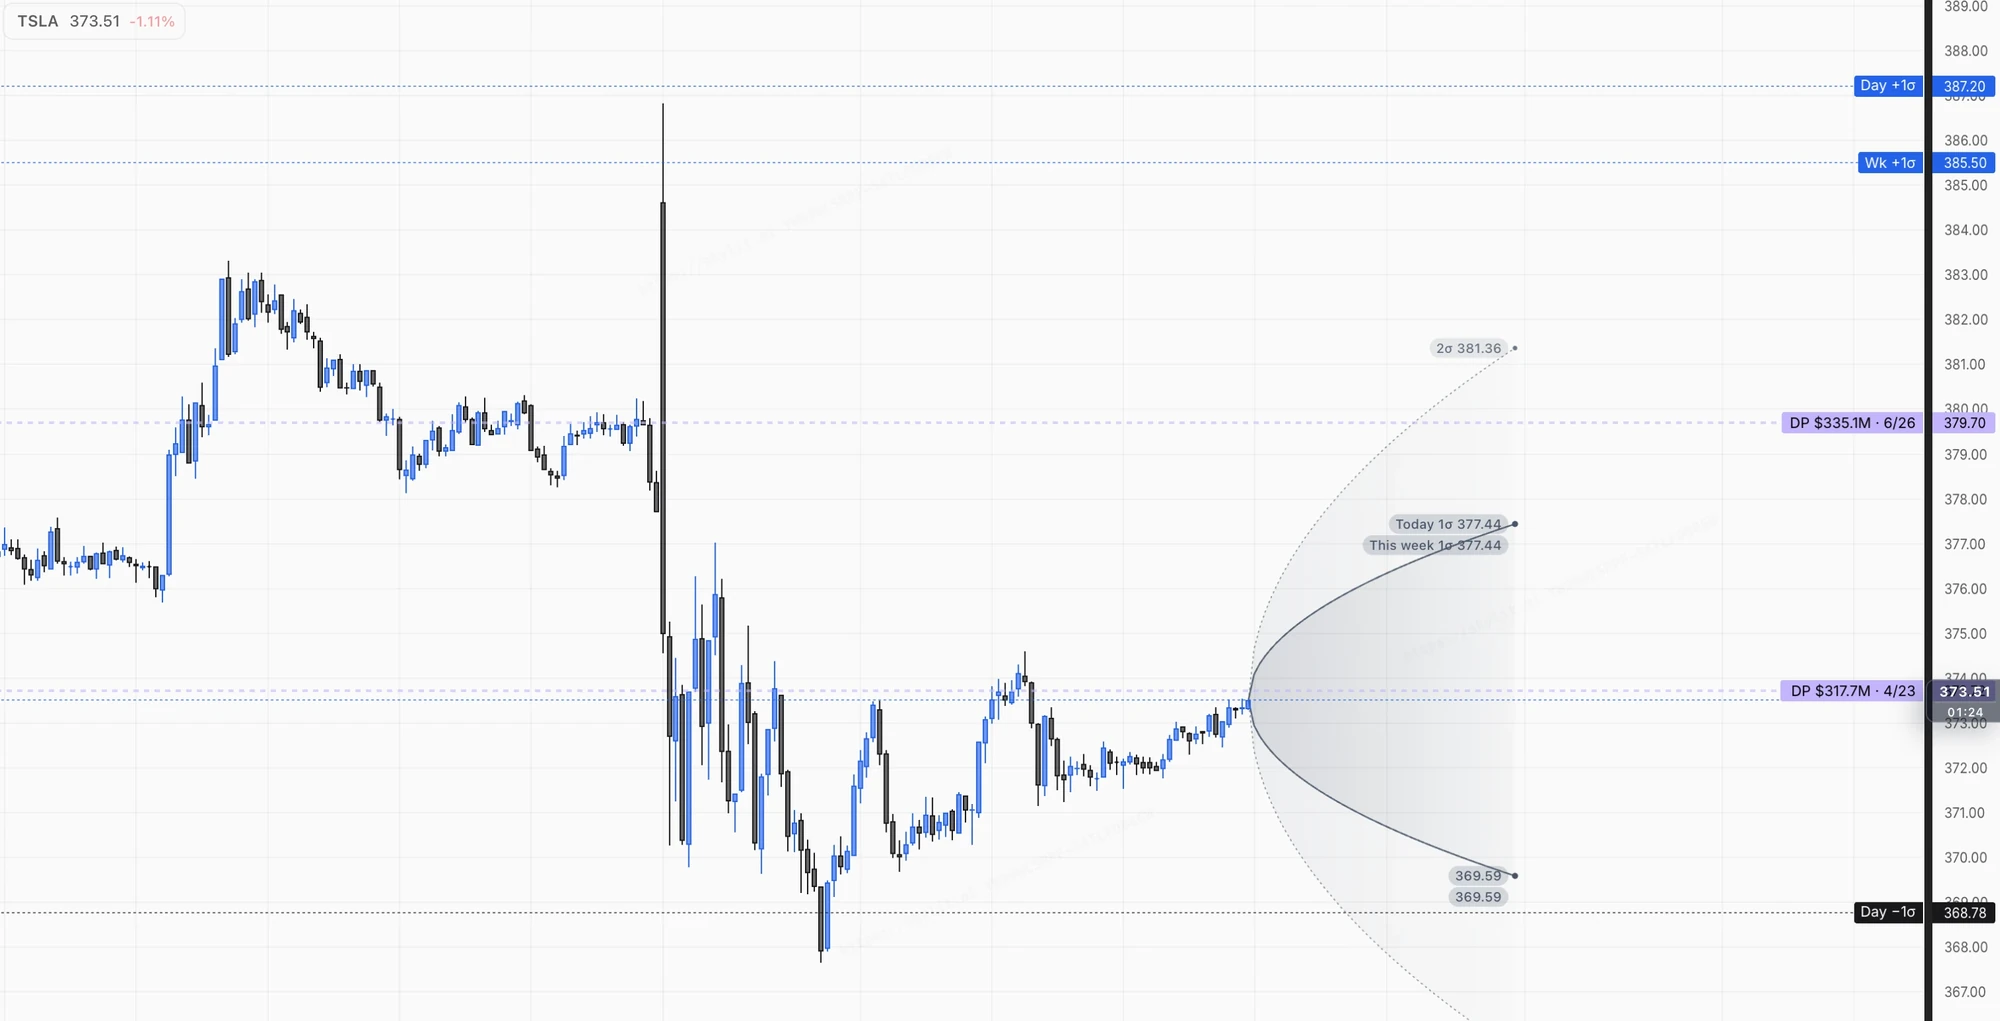
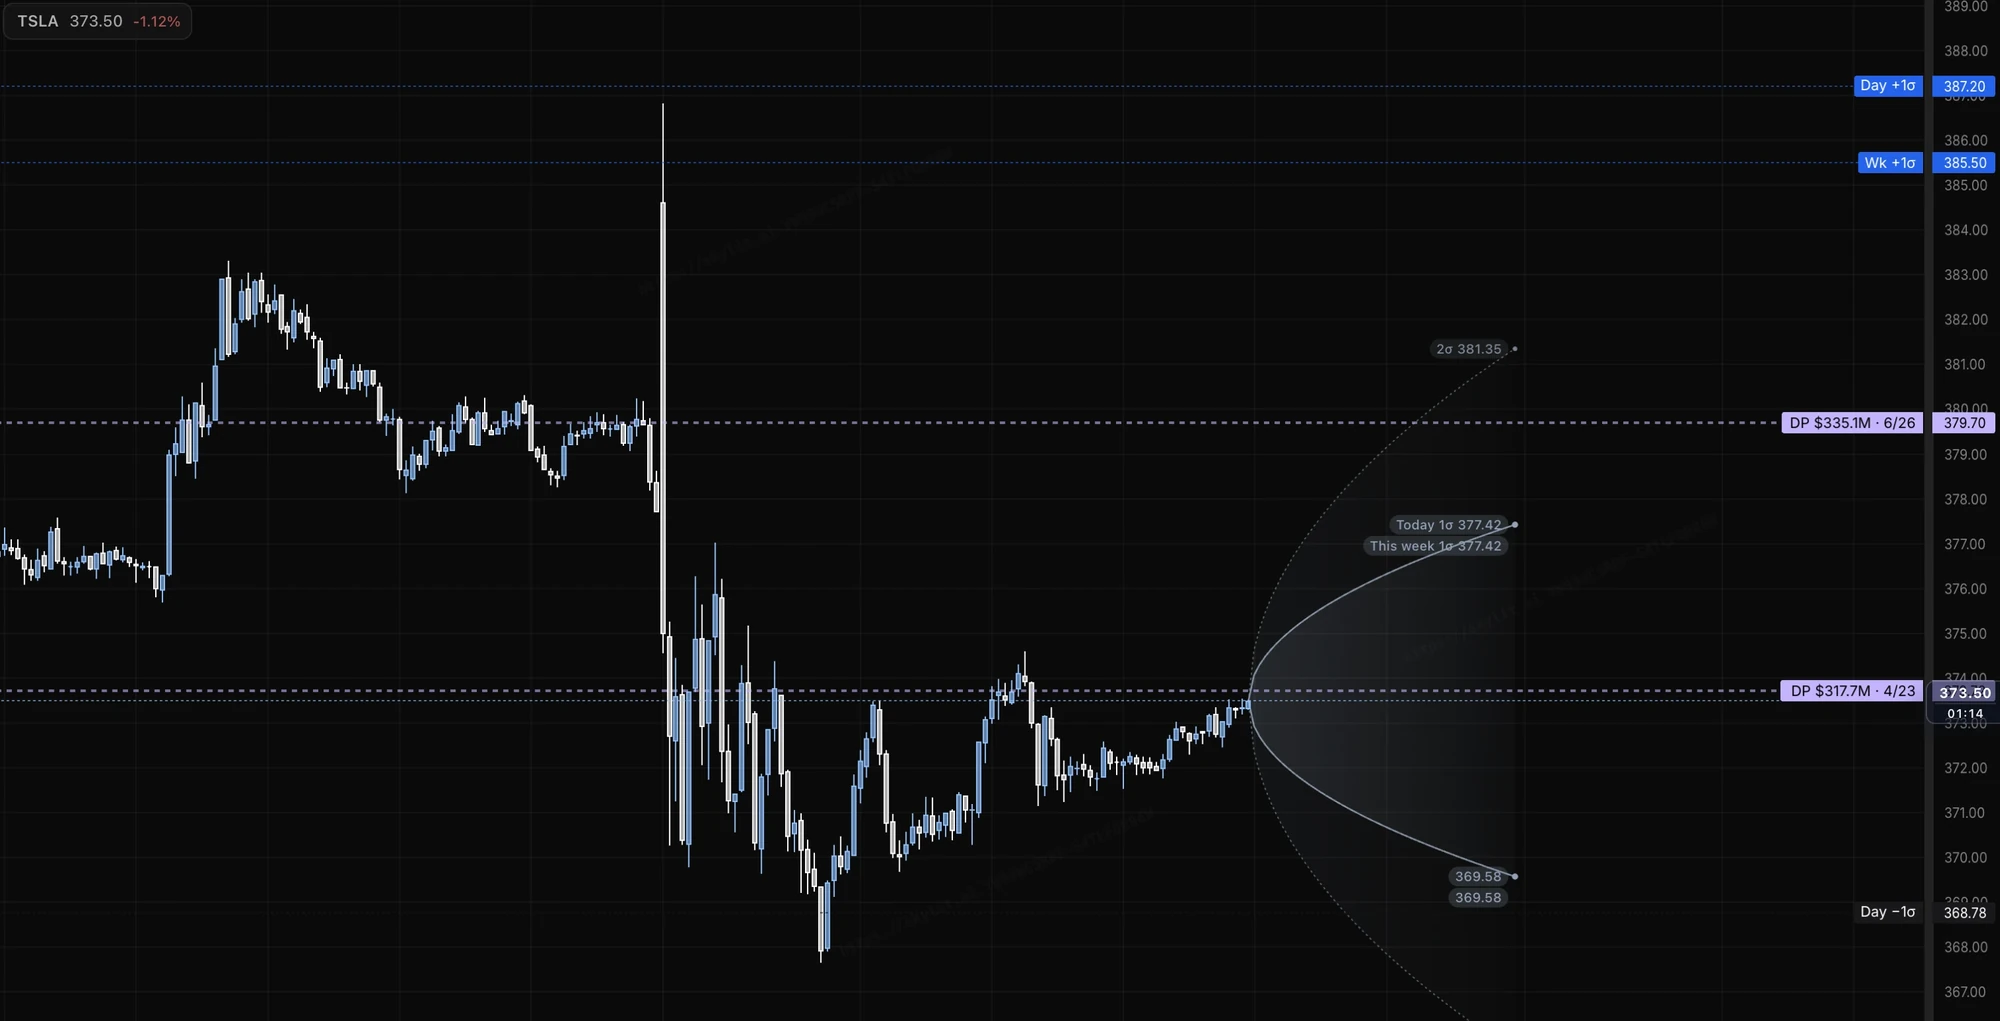
Why: see where positioning sits past the last candle, so you can plan around levels that are coming up. Where: Settings (Shift+S) > Projection.
- Switch Projection on.
- It follows your chart interval on its own: short on intraday charts, farther out on higher timeframes.
How to read it: Projection draws exposure zones ahead of price. It is a positioning scenario, not a probability forecast. Read it as "where the positioning sits ahead", not "where price will be".
Indicators
Why: add options flow, dark-pool levels and volume studies to the same chart, so you can check whether they agree with a node. Where: Settings (Shift+S) > the Add card below the indicator rows.
- Open Settings and press Add.
- Pick an indicator. It gets its own row in Settings with a cog for its options.
- Most indicators can be added more than once with different settings (for example two VWAPs with different anchors).
| Indicator | What it shows |
|---|---|
| Flow | Call premium above zero, put premium below, per candle. Filters: Leg Count (Single, Multi), Trade Type (Sweep, Non-Sweep), Moneyness (ITM, ATM, OTM), Trade Side (Bid, Mid, Ask), DTE, Flow Score and premium bounds. Click a bar to open the Flow Bucket: time range, trade count, net flow, calls vs puts, bucket and day put/call, and top contracts. |
| Dark Pool | The top dark-pool print levels over a lookback (defaults: top 3 over 45 days), labelled always or on hover. |
| VWAP | Volume-weighted average price, anchored to the session, week, month, quarter or year (or, on a stock, to an earnings, dividend or split date), with up to three bands. |
| GEX VWAP / VEX VWAP | Where the option board's exposure is centred, as a line with an optional band. Not a volume VWAP. |
| Flow VWAP, Net Premium | Flow-based companions to the Flow pane. Net Premium draws two running lines for the session: net call premium and net put premium. |
| Volume, CVD, Candle Delta, Footprint | Traded volume split into buys and sells from the tape. CVD (cumulative volume delta) is the running buy-minus-sell total. |
| Volume Profile, TPO | Volume at each price and time at each price, with Point of Control (the busiest price) and Value Area. |
| Session Levels, Session Zones | Prior-day, premarket, Asia, London, initial-balance, week and month highs and lows plus key opens. Session Zones shades each part of the session. |
| EMA, SMA, Bollinger | The usual moving averages and bands. |
docs.skylit.ai has a full page for GEX VWAP, VWAP, CVD, Volume Profile and TPO.
Sidecars
Why: keep the full heatmap, other markets, your watchlist and your alerts in view without leaving the chart. Where: Settings (Shift+S). Each sidecar has a switch and a dock side (left or right).
- Heatmap (Shift+H): the Heatseeker heatmap for the symbol you are charting, synced to the focused pane. Its cog sets velocity, dock side and header. A symbol with no option chain of its own (ES, NQ) shows a derived board, mapped from a related product.
- Trinity (Shift+T): up to 10 heatmaps side by side, one per symbol (SPXW, SPY and QQQ by default), saved with the layout. When a panel maps onto your chart, press the Spot pill in the Trinity header to show that panel in the chart's prices, so SPY strikes read as ES prices on an ES chart.
- Watchlist: your lists with live quotes, a Favorites section and columns you can choose.
- Alerts (Shift+A): every price alert you have, across symbols. Click a row to jump to that symbol. The dot switches the alert on or off.
Price alerts
Why: get told when price reaches a level, instead of watching the screen. Where: on the chart, or from a node in the Heatmap or Trinity sidecar. Manage them in the Alerts sidecar (Shift+A).
- Right-click the chart at the price you want and pick Add price alert here. To alert on a node instead, pick Alert on nearest node. You can also set one from a node in the Heatmap or Trinity sidecar.
- In the Create alert box, check the level and pick a Trigger: Once turns the alert off after it fires, Repeat keeps it on (with a short wait between alerts).
- An alert set from a node can either watch that exact price or follow the node if it moves to another strike. Pick the one you want.
- Turn on Alert Lines to draw this symbol's alerts as horizontal lines. Drag a line to move the alert to a new price. The cog styles the lines.
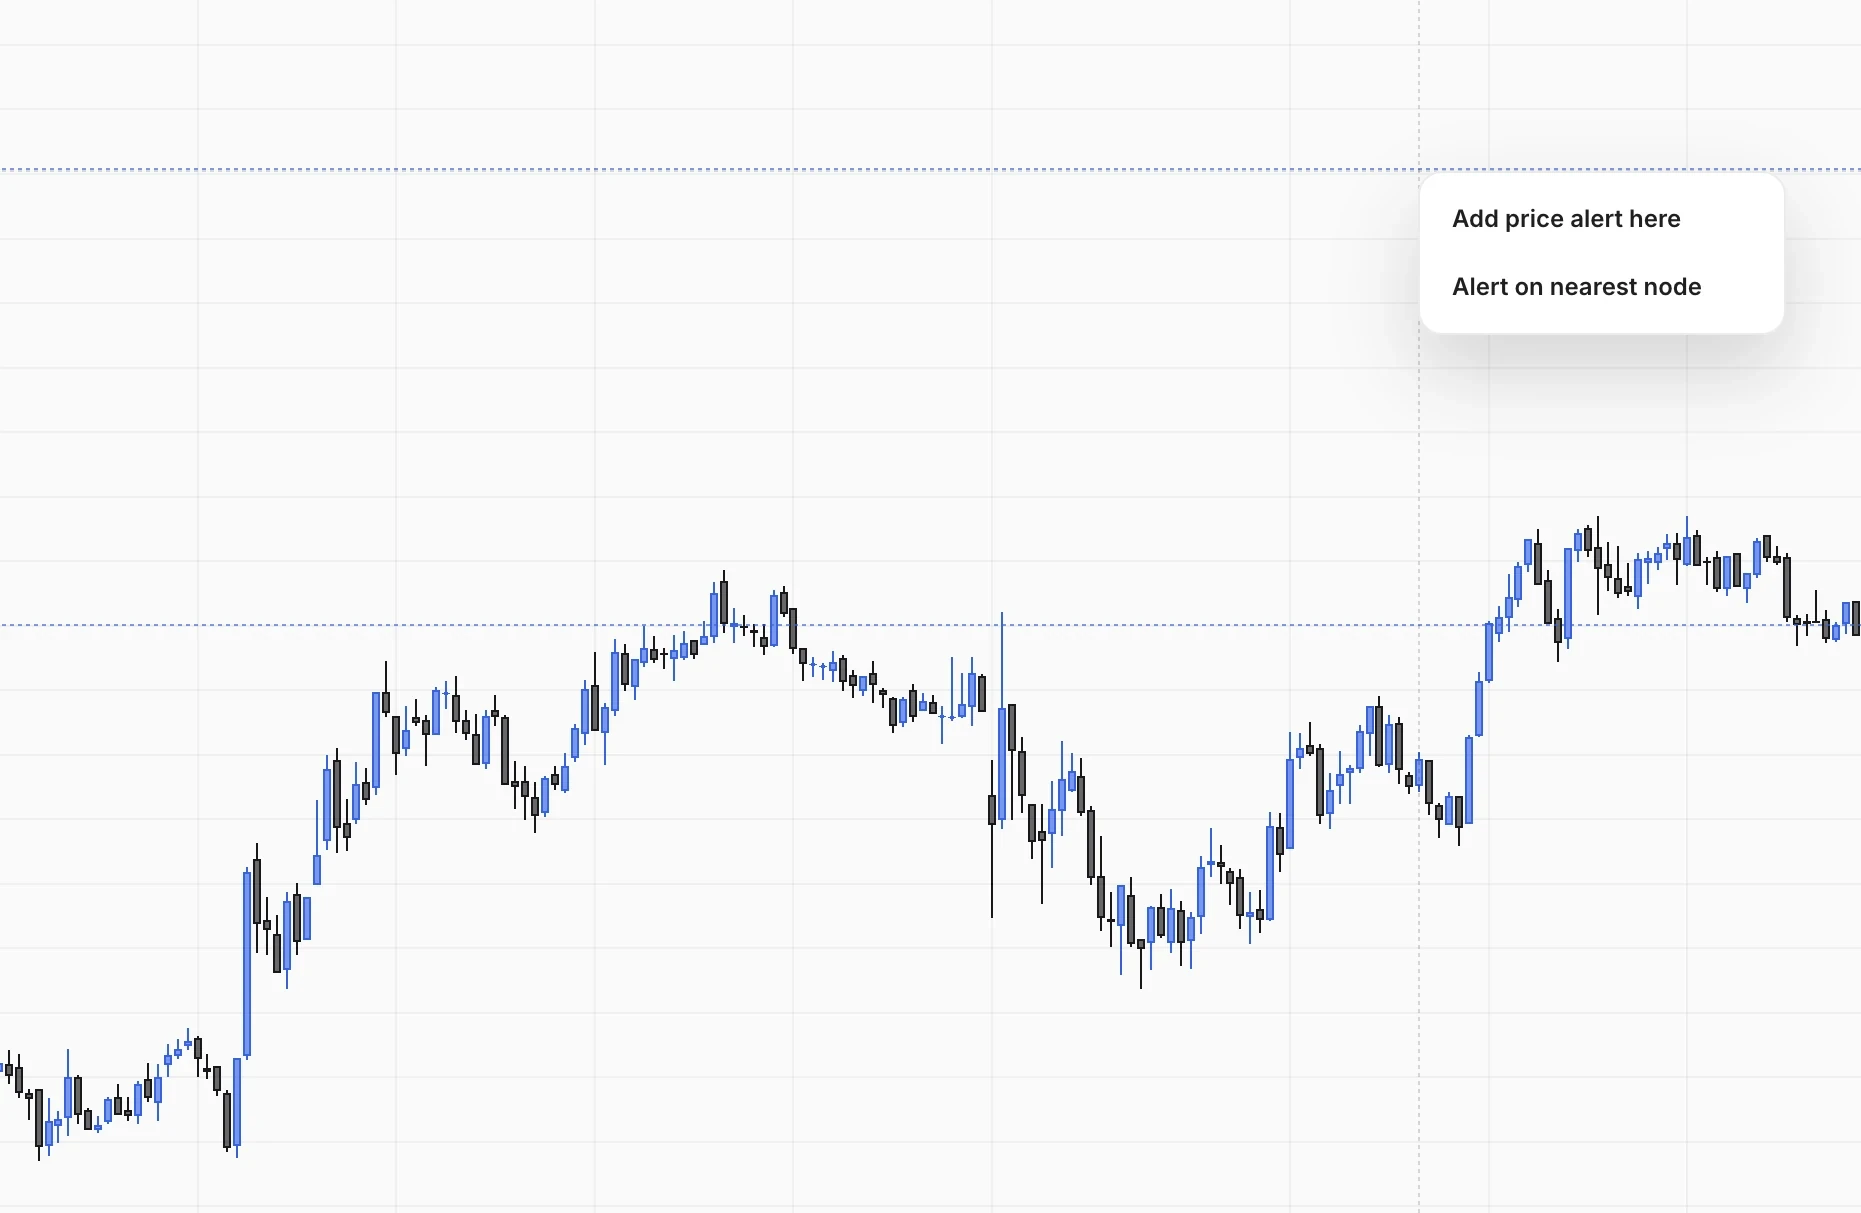
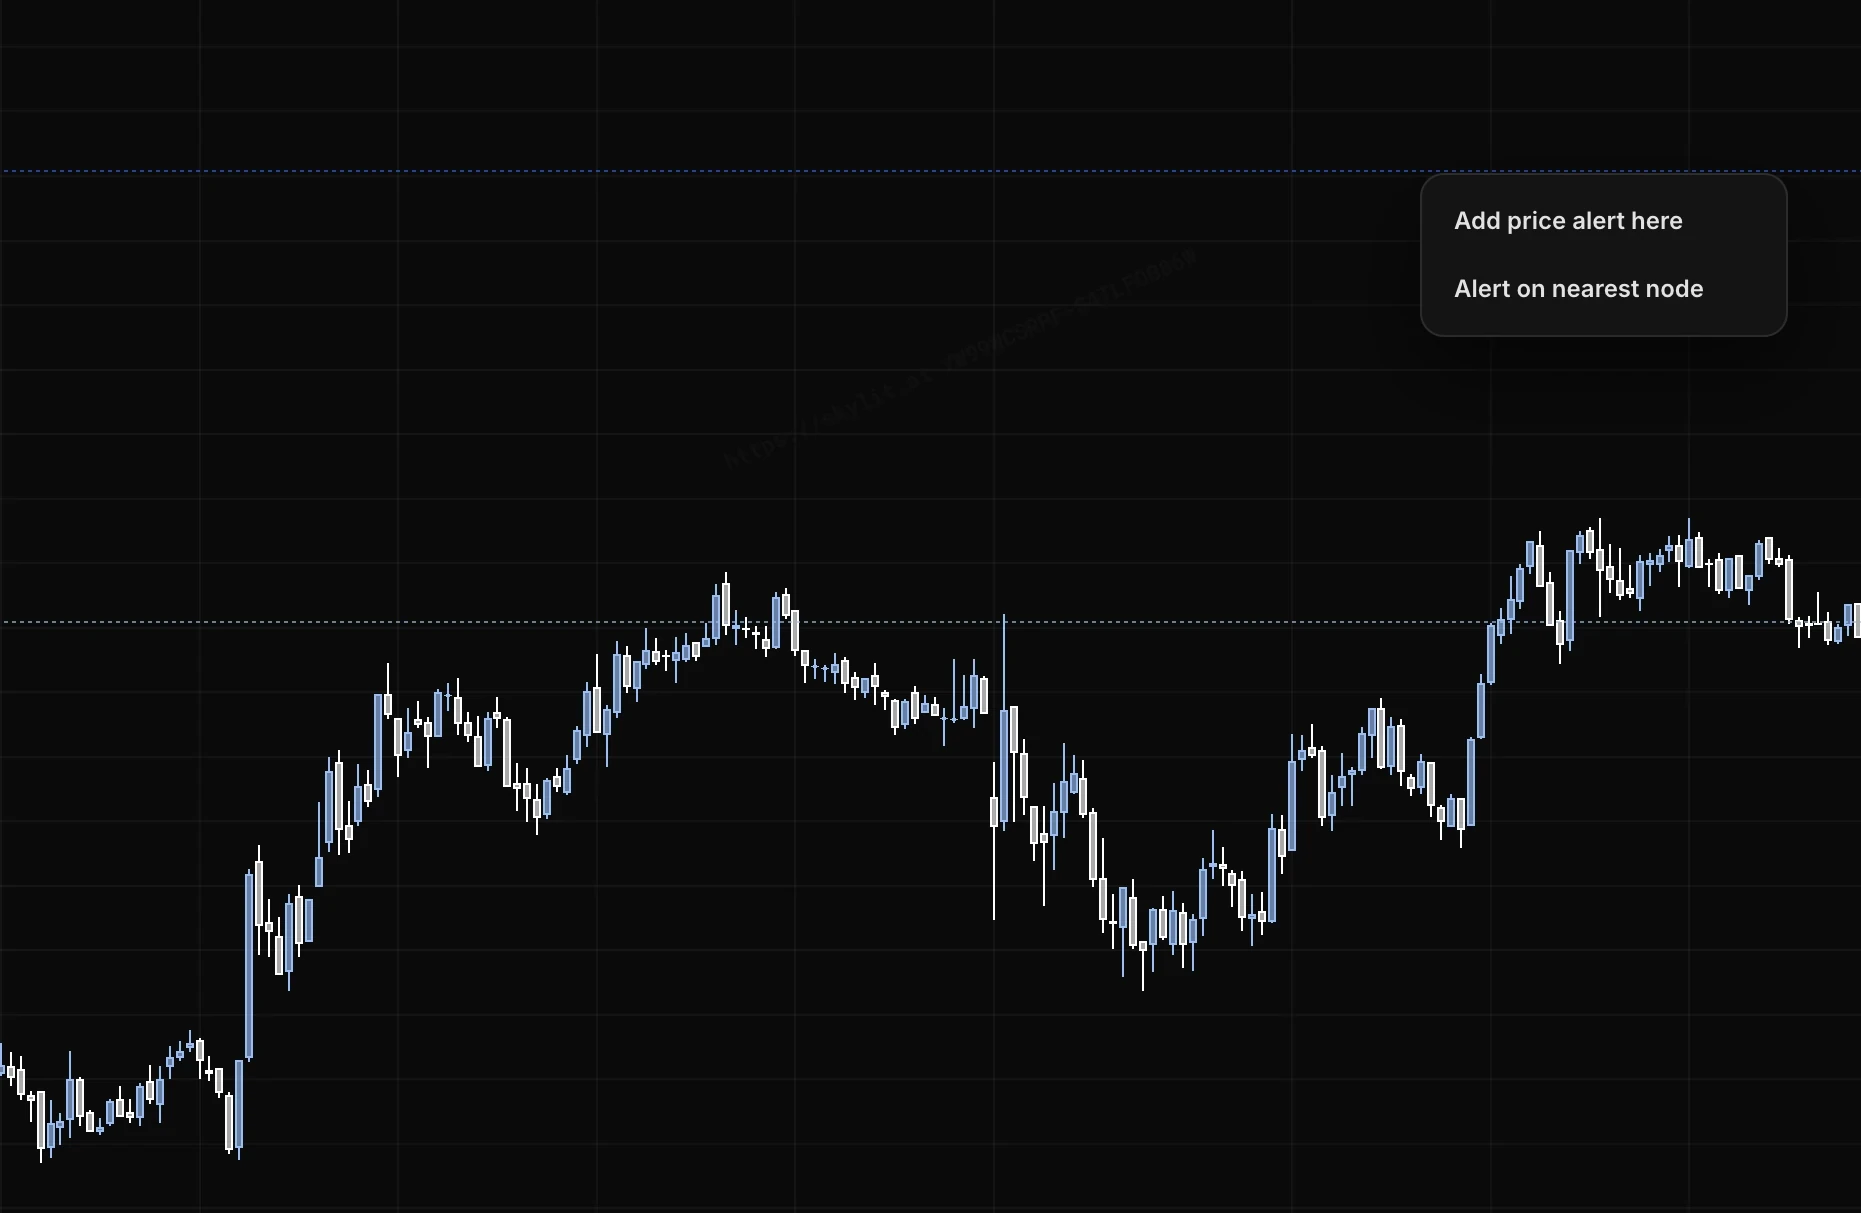
An alert fires as soon as price touches the level.
Drawings
Why: mark your own levels, trends and trade plans on the chart. Where: the drawing rail. Open it with the pencil icon in the chart header.
- Open the drawing rail and pick a tool, or use a shortcut from the table below.
- Click on the chart to place it.
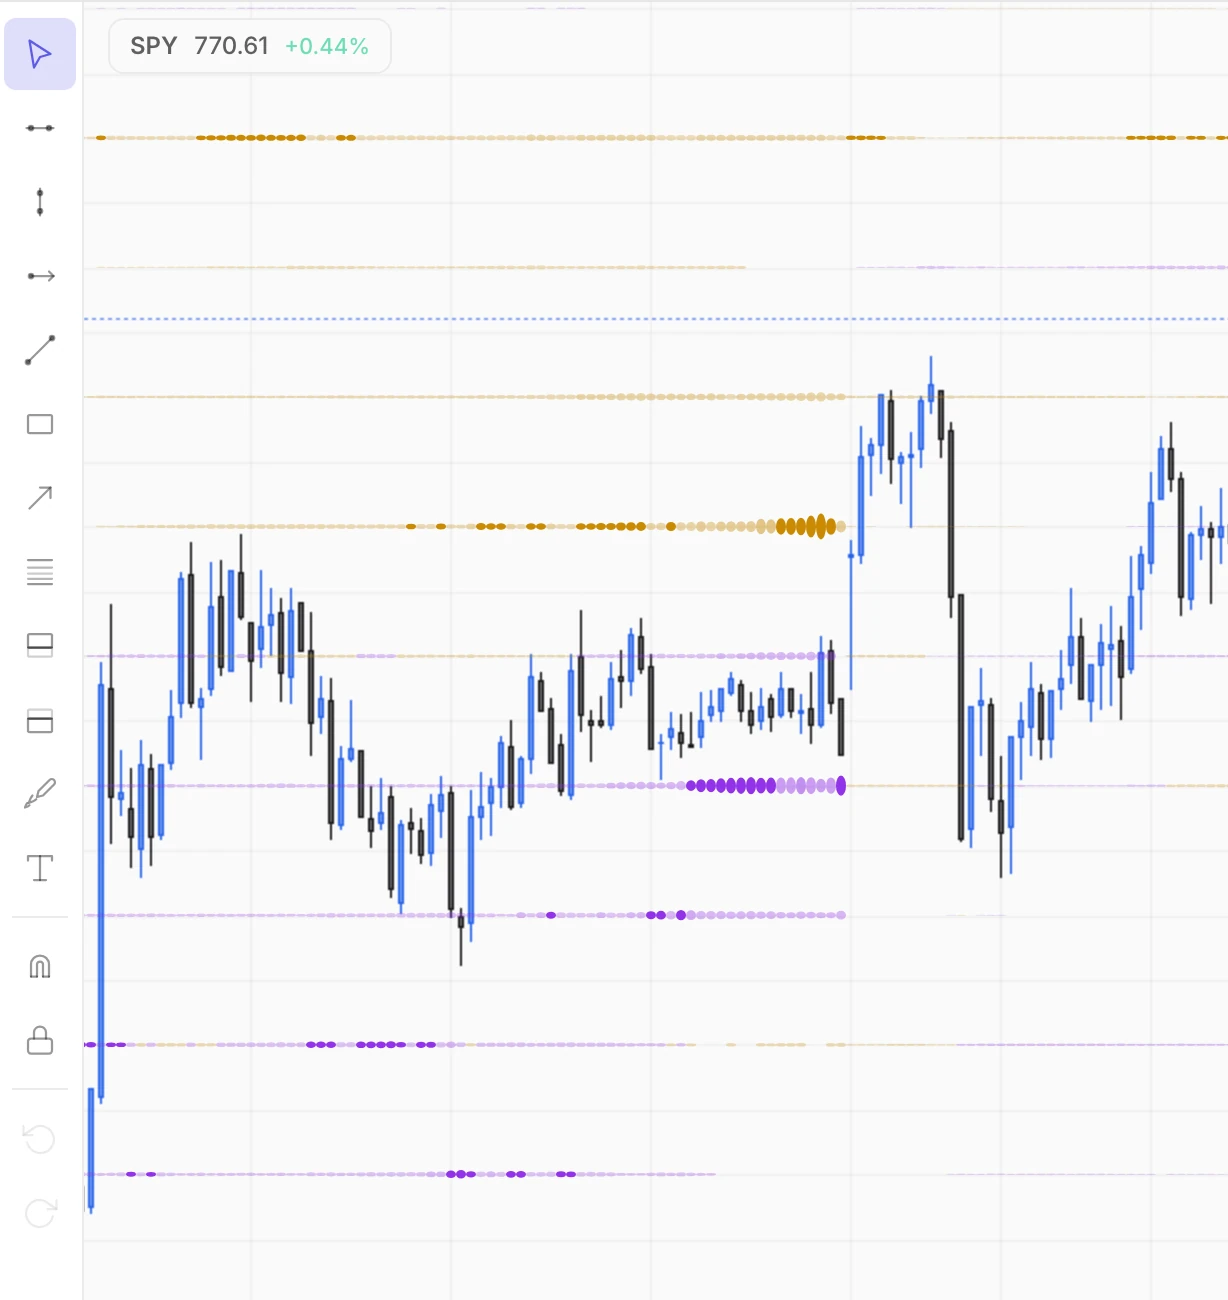
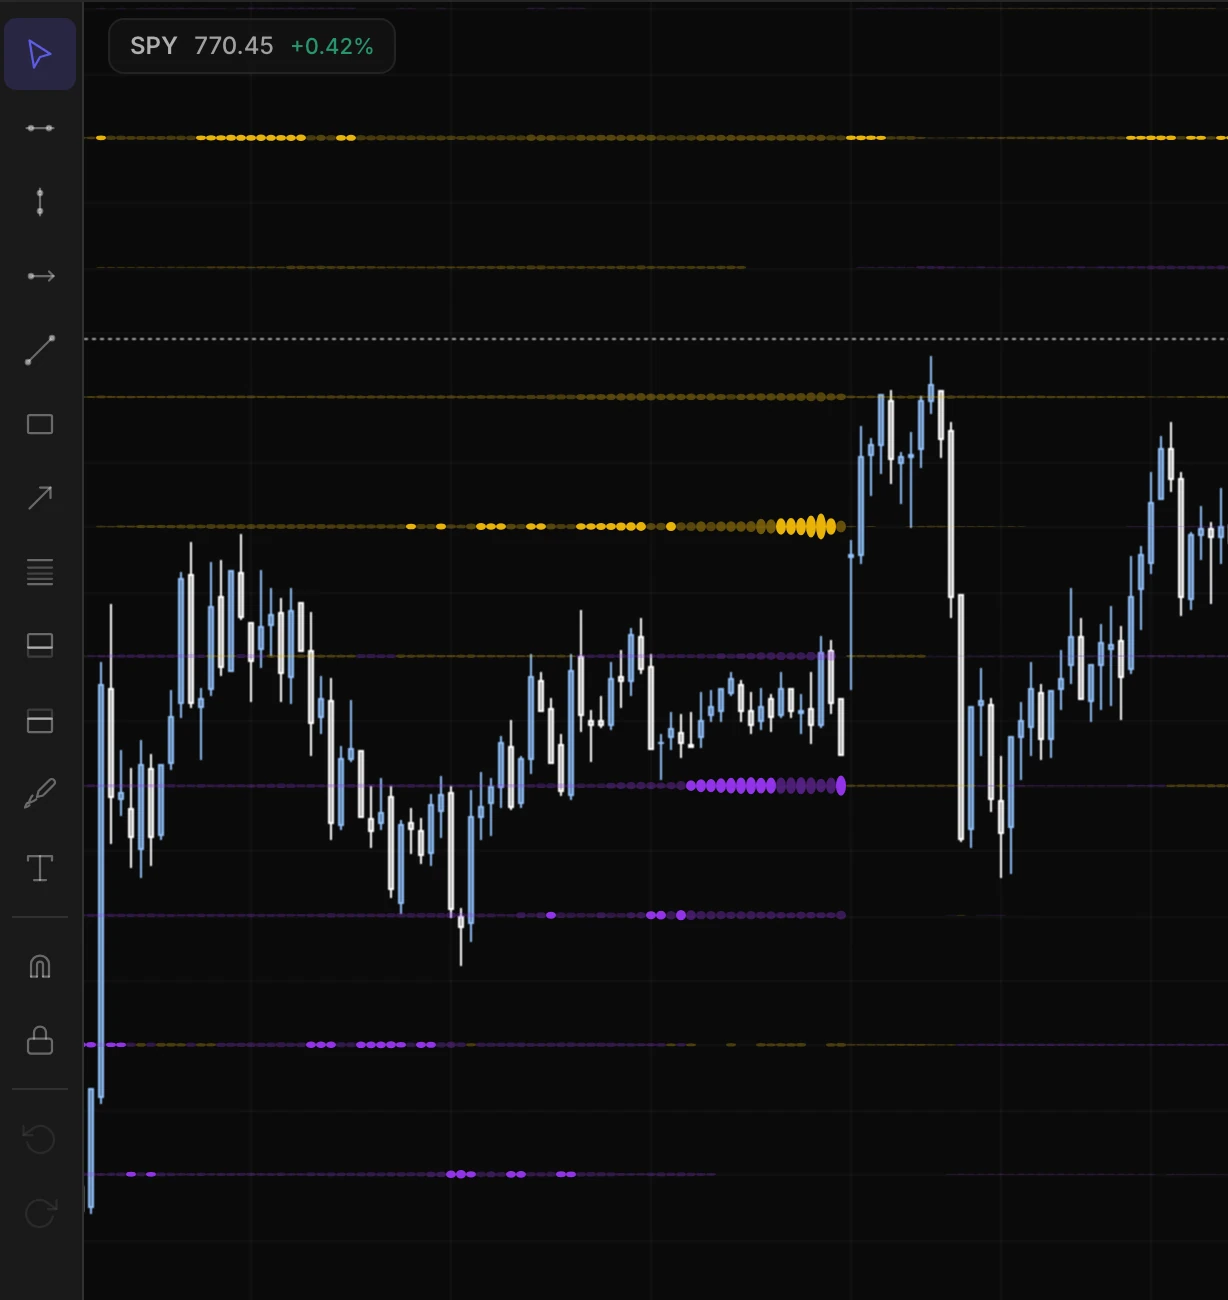
| Tool | Shortcut |
|---|---|
| Trendline | Alt+T |
| Horizontal line / ray | Alt+H / Alt+J |
| Vertical line | Alt+V |
| Rectangle | Alt+Shift+R |
| Arrow, brush, text | Alt+A, Alt+B, Alt+X |
| Fibonacci | Alt+F |
| Long / short position | Alt+L / Alt+S |
| Magnet (snap to a candle's open, high, low or close) | Alt+M |
| Select | Alt+P |
Drawing presets save a Fibonacci or line style under a name. Star one to make it the default for new drawings of that type. Presets sync to your account (up to 50 across all tools). Press ? to see every shortcut.
Replay
Why: review a past session, or practise reading a chart without knowing what happens next. Where: Replay in the chart header, or Shift+R.
- Press Replay (Shift+R).
- Use Select start and click the candle you want to start from, or press Random to drop in at a random minute.
- Press play. The session runs candle by candle, with the orbs, flow and overlays as they were at that minute.
In a layout with several panes, Replay runs every pane from the focused symbol's timeline. Replay is for review and practice. A setup that worked in Replay is one example, not a tested edge.
Plugins
Why: extra overlays for specific setups. Where: each plugin is a row in Settings and a group in the Add menu. Which ones you see depends on your plan.
- The Quiet Calf is a paid plugin: gap-fill, True Day Open, opening-range, range-expansion and prior-day high/low levels, plus Std Legs (an analyst's standard-deviation ranges). Its row shows a grey Paid tag if your plan does not include it. It is not on sale yet.
Trade from the chart
Why: see your positions where price is, and act on them without switching screens. Where: the Trade Deck and Traders rows in Settings. Needs a Nexus account.
- Trade Deck: your Nexus paper positions drawn on the chart, with one-tap paper trading. Its cog chooses whose positions to show.
- Traders: positions of traders you follow on Nexus, on this chart. The row appears once Trade Deck is set to include followed traders and one of them holds this symbol.
Common routines
These are rules of thumb traders use, collected from experienced traders and member Q&A. None of them is a tested signal.
Scalping and 0DTE
Settings that suit short holds
- Expirations Front, Nodes 3, 5 or 10 per candle, GEX view.
- 3-minute candles for fine detail. 5 or 10 minutes when you also watch heatmap velocity (how fast each node is growing or shrinking).
- Many scalpers look for reactions at nodes rather than breakouts: price reaches a node, and the question is whether it bounces off. They define risk just past the level.
Swings
Settings that suit multi-day holds
- Expirations one step wider than Front (To Friday or an exact count of 2), and look at VEX as well as GEX.
- Mark levels on 1H to 1D; use the lower intervals to watch how price behaves when it gets there.
- Match your Expirations and Nodes settings to your timeframe. Going from 5 to 10 nodes changes the picture a lot.
Confluence
Stacking independent reasons at one price
- A dark-pool level that lines up with a King Node is the classic confluence traders look for.
- Flow into negative-gamma strikes above price can speed a move up. The same flow into a strong positive node tends to stall there (from the "Reading Flow on Atlas" article).
- Many traders rotate through the Flow filters rather than hunting for one "best" setting. Activity that shows up under several filters, on a node, is the kind they mark.
Using Replay to learn
Practice on past sessions
- Use Random start and call the next level before you press play.
- Replay a day with Scroll as replay on, so the orbs you study are the ones you would have seen live.
Use it with other Skylit tools
| Tool | How it pairs with Atlas |
|---|---|
| Heatseeker | The source of the orbs. Use the full heatmap to see the whole board and velocity; use Atlas to see how price behaves at those strikes. Atlas is listed in the Heatseeker menu too. |
| Flowseeker | The source of the Flow pane and Dark Pool levels. Find a print in Flowseeker, then check on Atlas whether it landed at a node. |
| Nexus | Trade Deck and Traders put your Nexus positions, and those of traders you follow, on the chart. |
| Talon | Ask about the chart you are looking at. See below. |
Ask Talon
Why: get a plain-language read of the chart you are already looking at, using the same numbers you see. Where: Talon, on the Pro plan (see the Talon guide, "Who can use it").
Talon knows what is on your Atlas screen: the symbol, the interval, every pane in a multi-chart layout, whether you are viewing GEX, VEX or both, and which sidecars are open. When the Heatmap or Trinity sidecar is open, it also reads the positioning those panels show.
| You want | Ask Talon |
|---|---|
| A read of the charted symbol | "What's the read on this?" · "Where are SPY's levels for the week?" |
| One level | "Where's the king on TSLA?" · "Which way is AMD's skew?" |
| Context for a name | "/flow AAPL" · "/darkpool META" · "/earnings GOOGL" |
| A scan of your own Atlas list | "/watchlist Favorites" (Talon scans the lists you keep in Atlas) |
How it behaves:
- One symbol's read at a time. In a layout with several panes, the read covers the focused pane. Ask about another symbol by name and Talon looks it up separately.
- Open a sidecar for the fullest answer. Without the Heatmap or Trinity sidecar open, Talon still knows the chart but has no on-screen positioning to quote, so it looks it up instead.
- "Mark these on the chart" is not offered on the Atlas page. That button draws Talon's levels on the Talon canvas chart instead.
- Talon does not place, size or recommend trades.
Good to know
- Atlas is not a forecast. It shows positioning, flow and price together. It does not call direction and it is not a recommendation.
- Compare Atlas and the heatmap on the same setting. They use the same positioning data in different views. If the orbs and the heatmap disagree, the two are almost always set to different expirations. Set Expirations to Front to compare like for like.
- Check SPX price against another source. Some members have seen a gap between the SPX price on Atlas and on the SPX heatmap. If you work SPX levels to the point, confirm the price elsewhere.
- Derived levels move a little. On ES, NQ and SPXW, some levels are mapped from a related product. They drift slightly during the day as the two prices move apart (people call it "the wiggle"). A level that briefly disappears was hidden, not drawn in the wrong place.
- Projection and Replay are for planning and practice. Projection is a scenario, not a prediction. Replay and Scroll as replay are built to show only what was known at the time, and one good replay is one example, not proof.
- Routines are rules of thumb. The routines in this guide come from traders' experience, not from tested results.
- Heavy layouts can lag. Several panes, sidecars and many indicators can slow the chart on phones and on Chrome for Windows.
If something looks wrong
| You see | Do this |
|---|---|
| Orbs purple where the heatmap shows positive | Set Expirations to Front so Atlas matches the heatmap and Trinity. |
| A gap between SPX on Atlas and the SPX heatmap | Confirm the price against another source. Also check whether you are looking at a board derived from SPY. |
| Derived levels move a little on ES or NQ | Expected ("the wiggle"): they stay lined up with live price. To hold each strike on one line, turn on Derived at latest ratio in the Exposure cog. |
| A plugin row is grey with a "Paid" tag | It is a paid plugin your plan does not include. |
| Chart not updating | Hard refresh. Check the trade date is today and you are on the interval you expect. |
| Chart slow | Close sidecars and panes you are not using. Heavy layouts are costly on phones and on Chrome for Windows. |
| Cannot find Replay | Scroll the header to the right on a narrow window, or press Shift+R. |
What's new
September 2026
- Quick BUY and SELL buttons on the chart. Futures charts now show SELL, size and BUY buttons in the top row so you can place a market order without opening the ticket. They use your ticket's price and size, and are disabled, with a reason, when an order can't be placed. See Trade from the chart.
- Plugin toggles stay separate across tabs. Turning a plugin on or off in one Atlas tab no longer changes it in another tab open on a different layout. Each tab now keeps its own plugin settings. See Plugins.
- P10 in the Nodes dropdown. The chart's Nodes dropdown, and the Sniper lines list in Trinity, now include a P10 option alongside the existing choices. See Dealer positioning: the orbs.
- Leaving Atlas from the menu. Picking another page in the menu while on Atlas, such as Heatmaps, now opens it on the first click, with no flicker back. See Where to find it.
- Atlas in the Heatseeker menu. Atlas now also appears under HEATSEEKER, on desktop and phone, so you can jump between the heatmap and the chart in one tap. See Where to find it.
- Talon canvas uses your chart settings. The Talon canvas chart now opens with your Atlas colors, candles, Dark Pool settings and interval, so it looks like the chart you know. See Ask Talon.
- Custom chart intervals. You can add your own minute or hour intervals, such as 7m or 90m. They save with your pane and layout for next time. See Set up the chart.
- Trinity sidecar stays centred. After you zoom the browser or resize the window, the Trinity sidecar now re-centres on the spot row instead of drifting off to one side. See Sidecars.
- Flow VWAP for everyone. Flow VWAP is now open to every Atlas member. You add it from the Add card in Settings, alongside the other indicators. See Indicators.
- Net Premium pane. Net Premium draws running net call and net put premium lines for the session, so you see which side options money is building on. See Indicators.
- Flow bar selection at the live edge. When you click the newest Flow bar, or end a range on it, the outline marking the Flow Bucket's bars now stays visible. See Indicators.
Every Atlas update: skylit.ai/changelog/atlas.
Glossary
| Term | Meaning |
|---|---|
| Orb | A circle on the chart marking a Heatseeker node at its strike, bar by bar. Bigger and brighter means stronger. |
| Node | A strike where dealer positioning is concentrated. Yellow orbs are positive, purple negative (Default colors). |
| King Node | The strongest node on the board for the selected expirations. Other nodes' sizes are shown as a percentage of it. |
| GEX | Gamma exposure: dealer positioning that matters most for short-term support and resistance. |
| VEX | Vanna exposure: positioning traders lean on for multi-day bias and when volatility moves. |
| Derived | Exposure borrowed from a related product and mapped onto this chart's prices, such as SPY levels on ES. |
| Wiggle | The small drift of derived levels during the session as the two products' prices move slightly apart. |
| Front | The nearest expiration. |
| Velocity | How fast a node's exposure is growing or shrinking. Shown on the Heatseeker heatmap. |
| 0DTE | Options that expire today. |
| OPEX | The monthly options expiration (third Friday). Q-OPEX is the quarterly one. |
| Confluence | Several independent reasons (a node, a dark-pool level, VWAP, flow) at one price. |
| P-value (Nodes) | A Nodes setting (P15 to P60) that keeps every strike at least that percent of the King Node's size. |
| Sidecar | A panel docked beside the chart: Heatmap, Trinity, Watchlist, Alerts. |
| Trinity | Several heatmaps side by side (by default SPXW, SPY and QQQ) for cross-market context. |
| Flow Bucket | The detail view behind one Flow bar: its trades, net flow, put/call and top contracts. |
| Replay | Playing a past session back with the data as it was at each minute. |
| Scroll as replay | Sizing past orbs only by what was known at the time as you scroll back. |
| Projection | Exposure zones drawn past the last candle. A scenario, not a forecast. |
| Layout | A saved workspace: panes, symbols, intervals, overlays and sidecars. |
| Pane sync | The Sync row in the Pane layout menu: whether a change applies to all panes or only the focused one. |
| RTH / ETH | Regular trading hours; extended hours (pre-market and after-hours included). |
Last updated