 Atlas
RSI
The Relative Strength Index in its own pane on a fixed 0 to 100 scale, with overbought and oversold levels, optional smoothing and divergence lines.
RSI measures how hard recent closes have pushed up versus down, on a fixed 0 to 100 scale. Above 70 is the classic overbought zone, below 30 oversold. On SPY, a 5-minute RSI pinned near 80 into a level tells you the move is stretched. It doesn't tell you it's over: in a strong trend RSI can stay high for a long time.
Atlas draws it in its own pane under the chart, with the levels shaded, and can add a smoothing line, Bollinger Bands on the RSI itself, and regular bullish and bearish divergence lines.
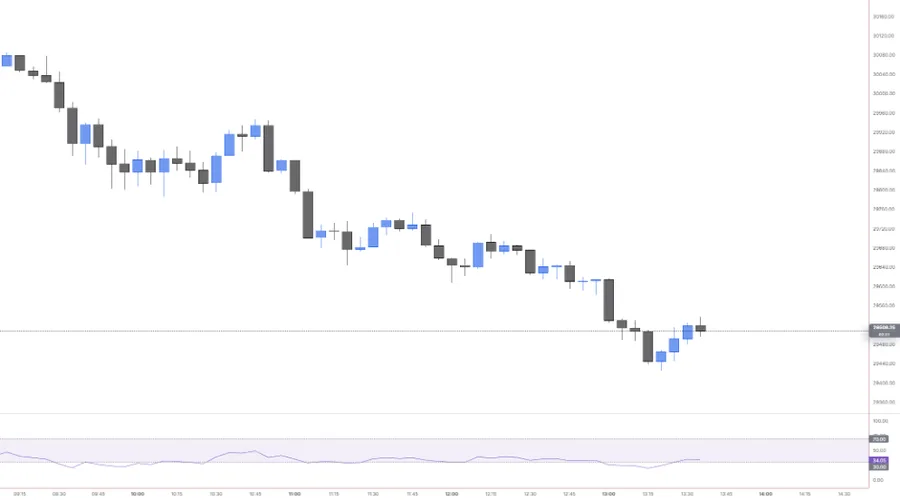
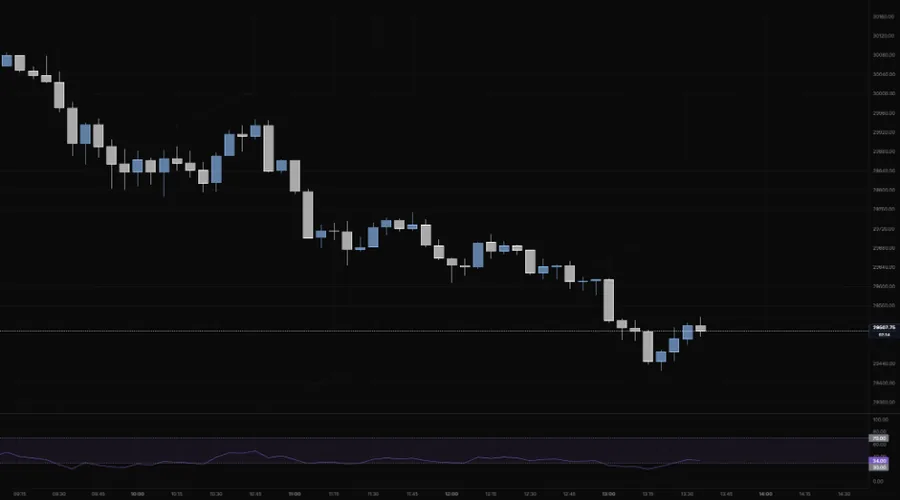
NQ 5m, Oct 16, 2026 · Atlas
Adding the indicator
Open the chart settings panel and use the Add button in the Indicators section. RSI is the first entry in the Subpane group. You can run more than one (an RSI 14 beside an RSI 2), each in its own pane.
Settings
| Setting | Options | What it controls |
|---|---|---|
| Length | 14 (default) | The RSI lookback. |
| Source | Close (default), Open, High, Low, HL2, HLC3, OHLC4 | The price each bar feeds in. |
| Divergence | Off (default), On | Draws regular bullish and bearish divergences between RSI and price. |
| Smoothing: Type | None (default), SMA, SMA + Bollinger Bands, EMA, SMMA (RMA), WMA | Adds an RSI-based moving average. SMA + Bollinger Bands also draws bands around it. |
| Smoothing: Length | 14 (default) | The length of that moving average. |
| BB StdDev | 2 (default), 0.001 to 50 | Band width, used by SMA + Bollinger Bands. |
| RSI line, RSI-based MA, Bollinger Bands, Bands fill | Colour, width, opacity | Styling for each piece. The RSI line is purple by default. |
| Bullish / Bearish | Colour, width, plus a Label toggle (on) | The divergence lines and their labels. Green and red by default. |
| Upper / Lower | 70 / 30 (default), each can be hidden | The overbought and oversold levels, 0 to 100. |
| Middle | Off (default), level 50 | An optional middle line. |
| Levels | Dashed (default), Solid, Dotted, plus a colour | How the level lines look. |
| Fill | On (default), Off | Shades the band between the upper and lower levels. |
Reading notes
- The forming bar's value can change until that bar closes.
- Divergence lines show up five bars late, on purpose. A swing point only counts once it has five bars on each side, and the previous swing has to be 5 to 60 bars back. That delay is the honest cost of confirming a pivot rather than guessing one.
- Read it with the trend. An overbought RSI in a strong uptrend is often just the uptrend doing its thing, not a reversal signal on its own.
- Want the candles marked instead? The RSI × Bollinger Combo colours the candles where RSI and the price Bollinger Bands agree.
Last updated