 Atlas
CPR (Central Pivot Range)
Pivot, top and bottom central levels, four resistance and four support levels, and the prior day's high and low, all from the prior trading day.
CPR draws a day's pivot levels from the prior day's high, low and close. In the middle sits the pivot (P) with the top central (TC) and bottom central (BC) around it, shaded as a band. Above are four resistance levels (R1 to R4), below four support levels (S1 to S4), plus yesterday's own high and low (Prev High, Prev Low).
The width of the central band is the classic read. Many traders treat a narrow CPR on ES as a hint that the day could trend, and a wide one as a hint it's more likely to rotate. Treat that as a framing, not a forecast. Each day gets its own set, drawn across that day only.
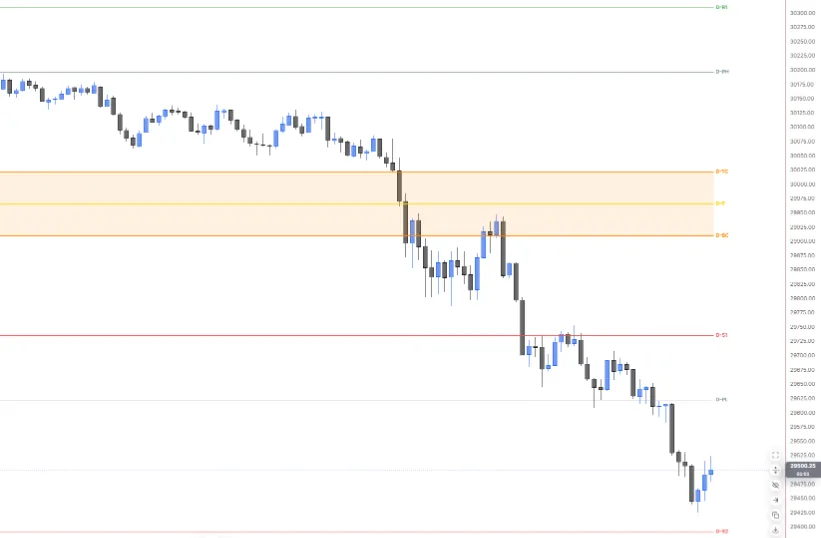
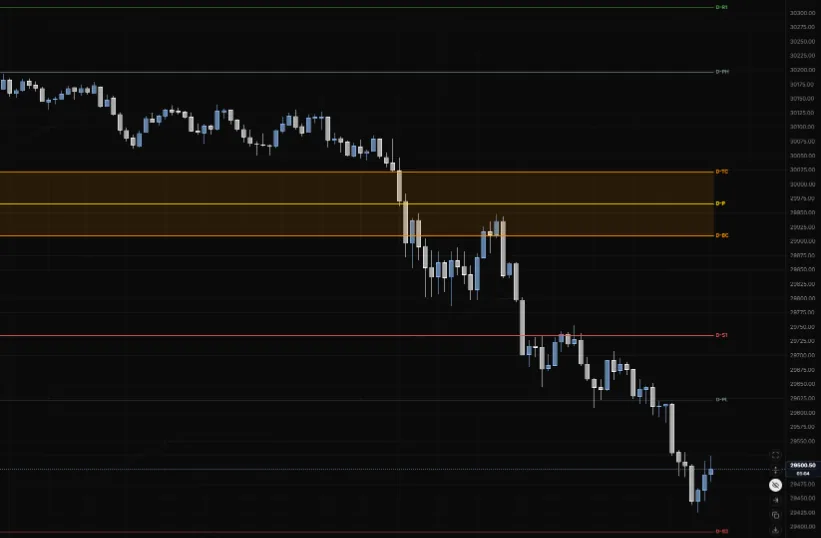
NQ 5m, Oct 16, 2026 · Atlas
Adding the indicator
Open the chart settings panel and use the Add button in the Indicators section. It's listed as CPR (Central Pivot Range) in the Overlay group. One instance per chart pane.
How the levels are built
From the prior trading day's high (H), low (L) and close (C):
| Level | Formula |
|---|---|
| P | (H + L + C) / 3 |
| BC and TC | (H + L) / 2, and 2 × P minus that. Whichever is higher is TC. |
| R1 | 2 × P minus L |
| S1 | 2 × P minus H |
| R2 | P + (H minus L) |
| S2 | P minus (H minus L) |
| R3 | H + 2 × (P minus L) |
| S3 | L minus 2 × (H minus P) |
| R4 | R3 + (R2 minus R1) |
| S4 | S3 minus (S1 minus S2) |
| Prev High / Prev Low | H and L themselves |
Settings
| Setting | Options | What it controls |
|---|---|---|
| Level groups | Pivot, TC/BC, Resistance, Support, Prev High/Low | Each level can be turned on or off. All are on by default. Each group has its own colour: gold pivot, orange TC/BC, green resistance, red support, grey prior high and low. |
| Fill | On (default), Off | Shades the band between TC and BC. |
| Fill opacity | 0 to 0.5, 0.12 by default | How strong that shading is. |
| Line width | 1 (default), 2, 3, 4 | Thickness of every level. |
| Line opacity | 10% to 100% (default) | Strength of every level. |
| Labels | Show (default), Hide | The short names on each line (P, TC, BC, R1, S1 and so on). |
Reading notes
- The trading day depends on the market. Futures use the CME session day, 18:00 to 17:00 ET. Stocks and ETFs use the regular session.
- Intraday charts only. On a daily or weekly chart a single bar already is the day, so nothing draws and the cog says so.
- Levels are fixed for the day. They're set from yesterday's finished bar, so nothing moves while today trades.
Last updated