 Atlas
Candle Delta
Each candle's buy-minus-sell volume printed under the bar with its total, plus a marker on candles whose delta disagrees with their direction.
Candle Delta prints what each bar's aggressive buyers and sellers actually did: the buy volume minus the sell volume, right under the candle, with the bar's total volume beside it. It's the same trade-side data CVD adds up, read one bar at a time instead of as a running total.
The most useful part is the divergence marker. A small amber triangle above a candle means its delta disagrees with its direction: it closed up on net selling, or down on net buying. A flat close with heavy one-sided pressure counts too, since that's absorption. On NQ, a green candle into a high with a negative delta under it is the kind of bar worth a second look.
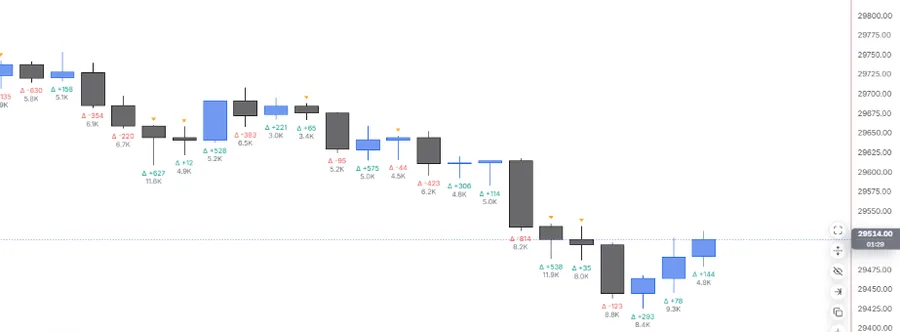
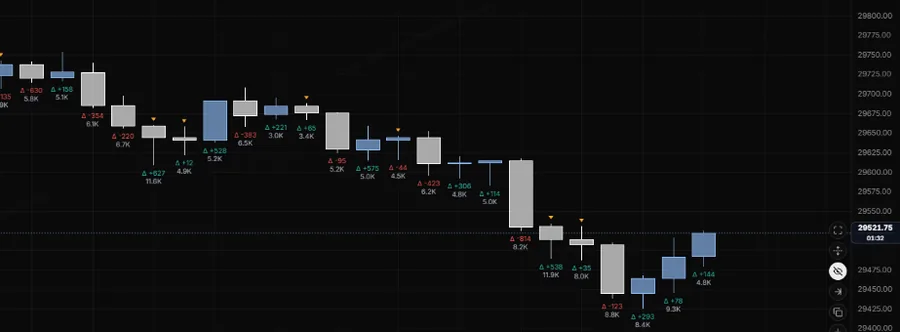
NQ 5m, Oct 16, 2026 · Atlas
Adding the indicator
Open the chart settings panel and use the Add button in the Indicators section. Candle Delta sits in the Overlay group, just after the VWAPs. One instance per chart pane.
Settings
| Setting | Options | What it controls |
|---|---|---|
| Delta | Up colour, down colour | The colours for positive and negative delta. Teal and red by default. |
| Total volume | On (default), Off | Prints the bar's total volume alongside its delta. |
| Divergence | On (default), Off, plus a colour | Marks candles whose delta contradicts their direction. Amber by default. |
Reading notes
- Numbers need room. The labels appear as you zoom in far enough for them to fit. The divergence markers stay visible at any zoom.
- Only known trade sides count. Volume whose side can't be read is left out of the delta rather than guessed.
- On stocks and ETFs the volume is a sample of the full tape, so read the sizes as relative, bar against bar, not as absolute share counts. Futures read their own full tape.
- SPXW uses ES futures delta from regular hours, since the index itself doesn't trade. VIX has no volume source, so nothing draws there.
Last updated