Heatseeker

See where dealers are positioned, strike by strike.
Dealers hedge mechanically to stay neutral, and those hedging flows can move price. Heatseeker maps dealer exposure at every strike and every expiration, so you can see where price may stall, bounce or speed up before it gets there.
The problem
Every level on your chart looks the same until price hits it.
- You draw ten lines and have no idea which one price will actually respect.
- Price slices through a level you trusted and stalls at one you never marked.
- By the time you know a level mattered, the move is already over.
With Heatseeker
Know which strikes carry weight before price arrives.
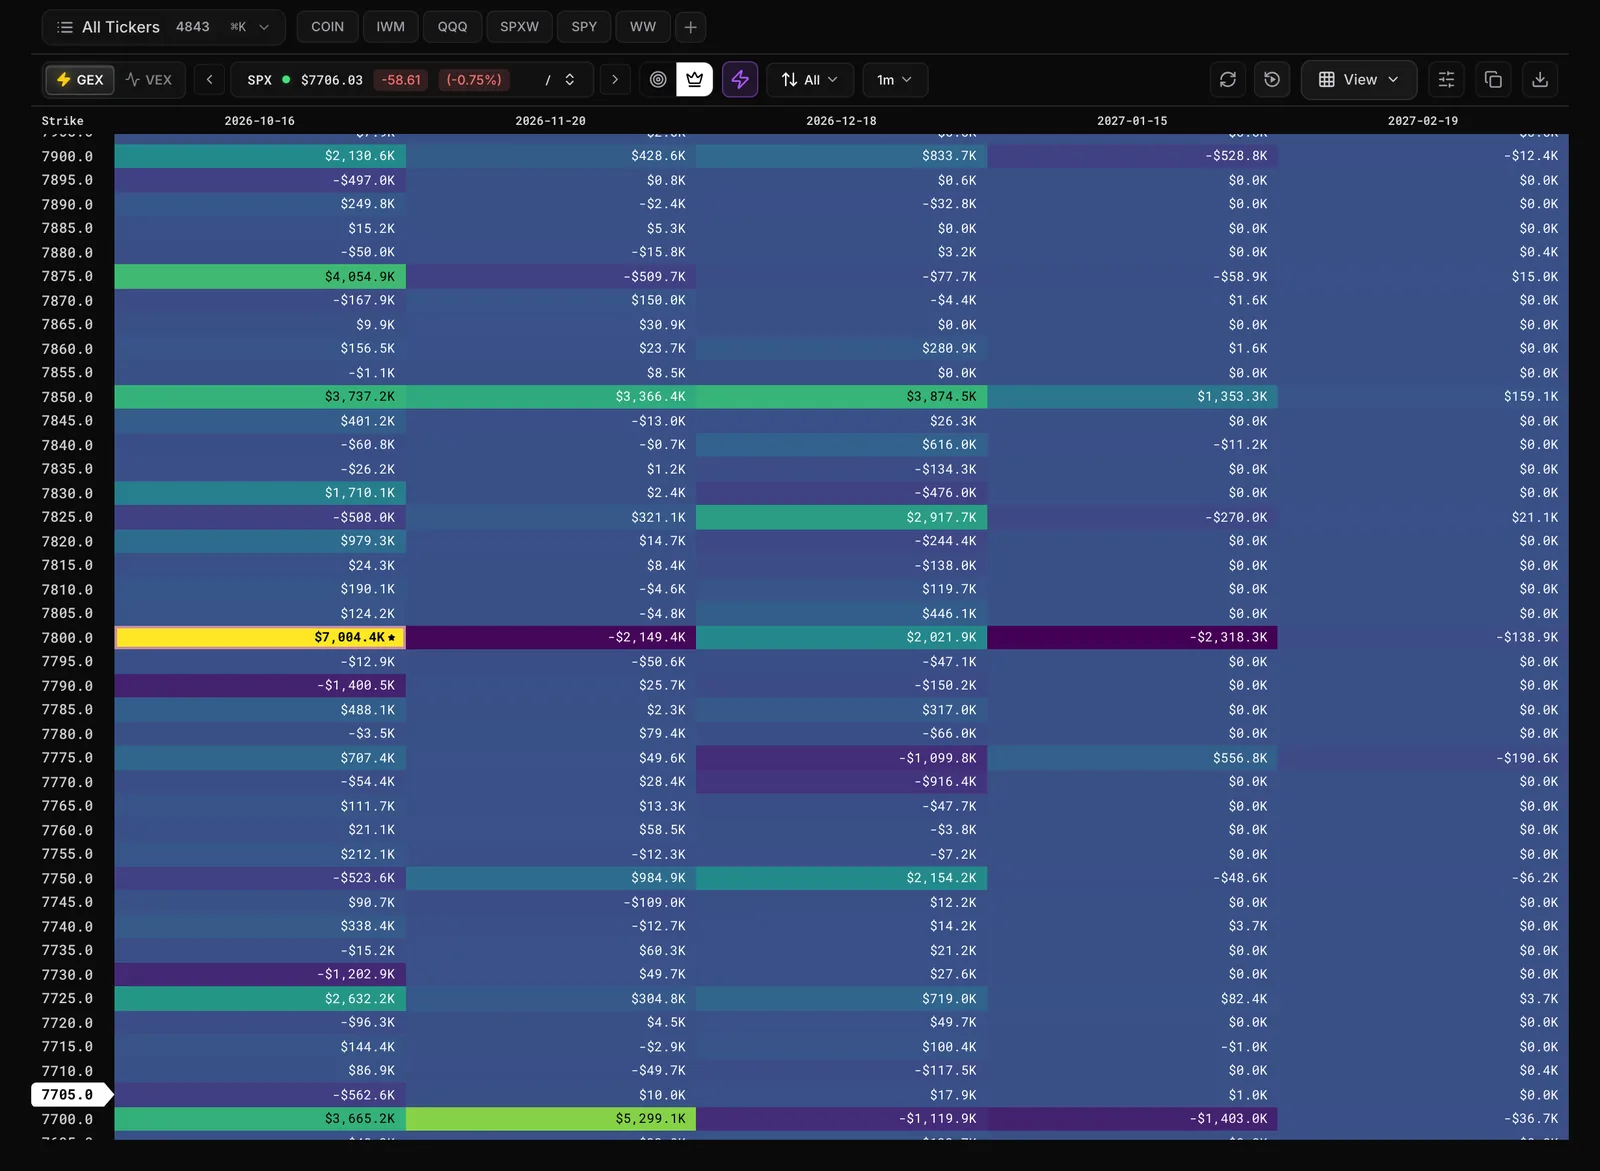
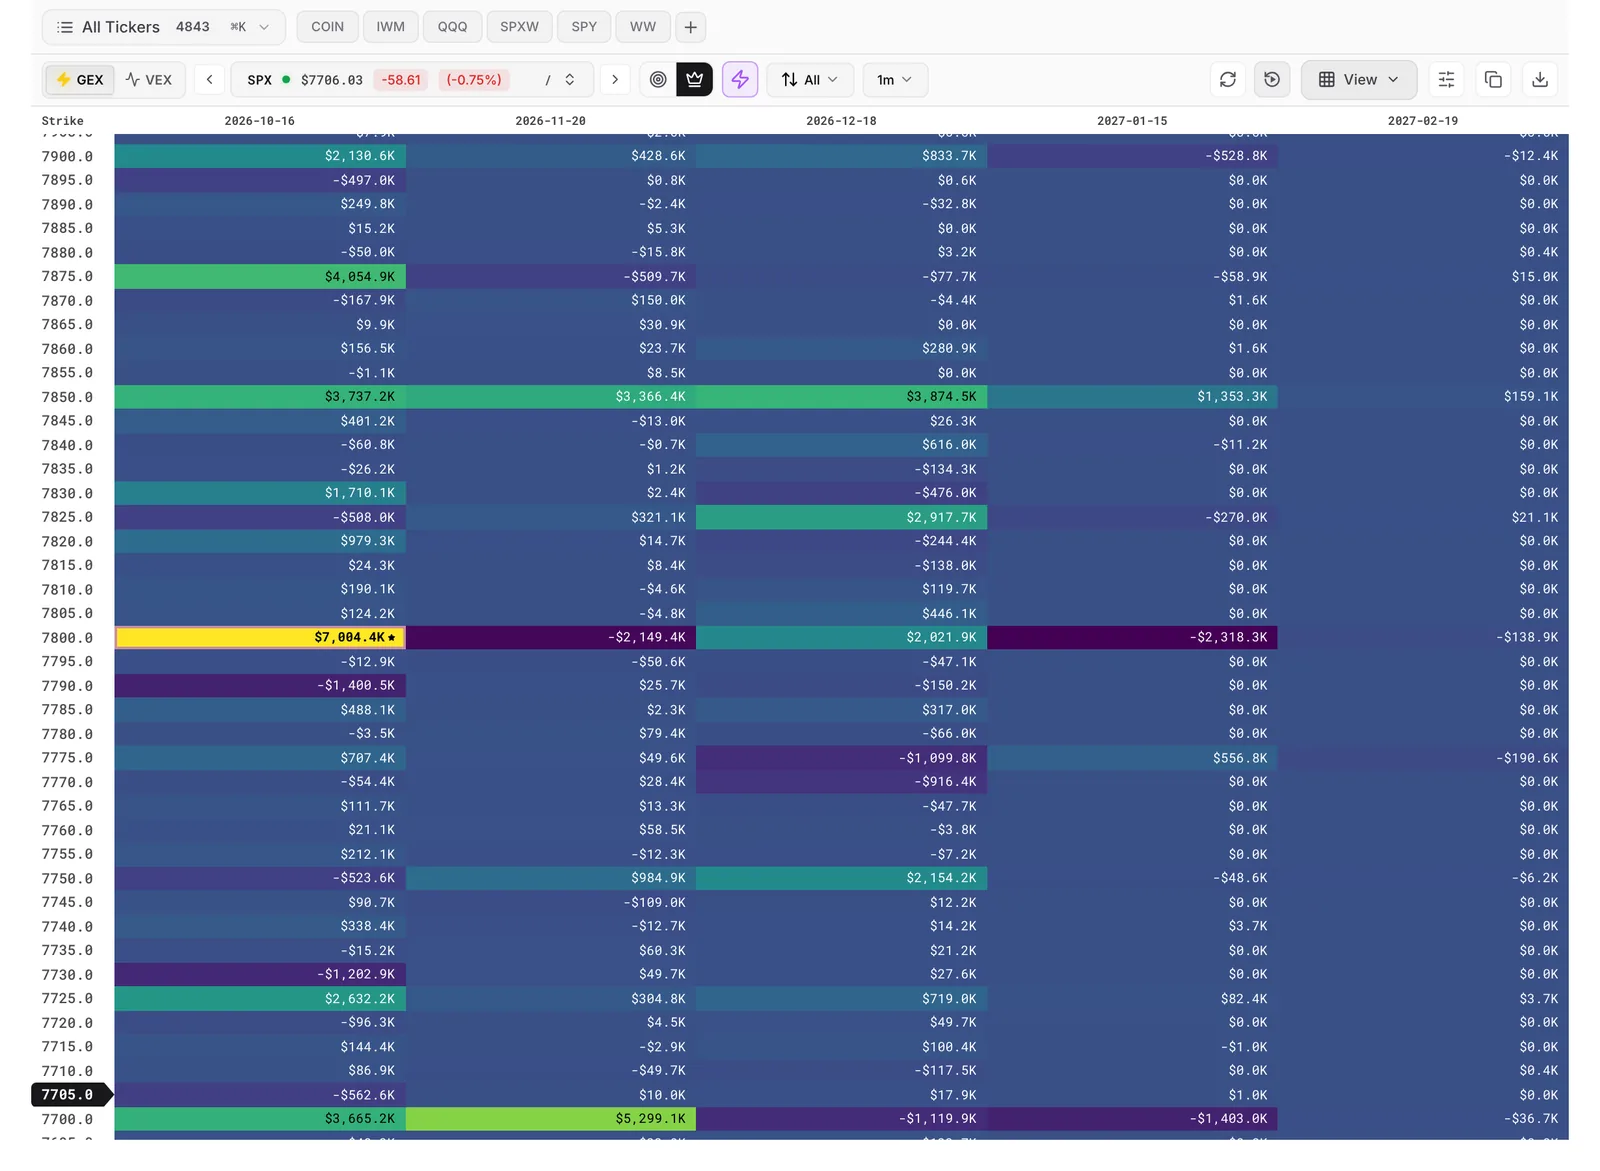
Some strikes carry so much dealer hedging that price tends to stall, bounce or pin there. Others are thin, and price slides through them fast. Heatseeker shows you both on one board, with the biggest node starred, so you can plan around the levels that matter and wait for price action to confirm them.
How it works
Heatseeker, step by step
Pick a ticker and a view
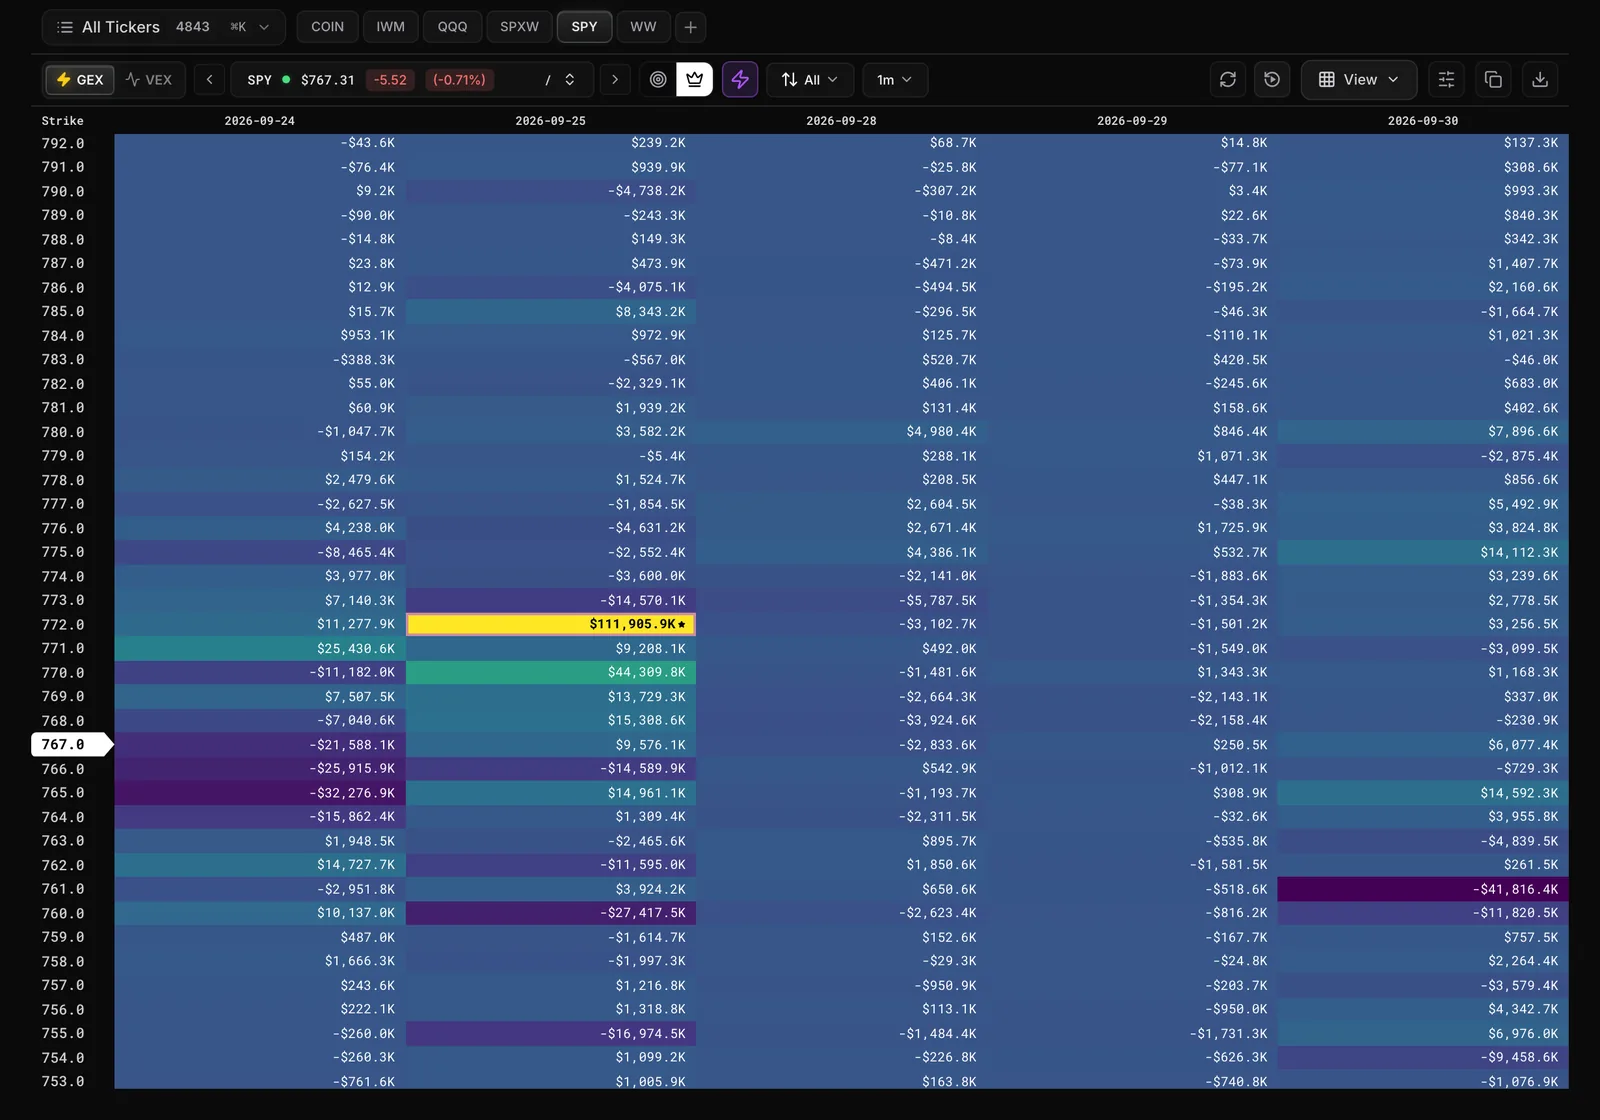
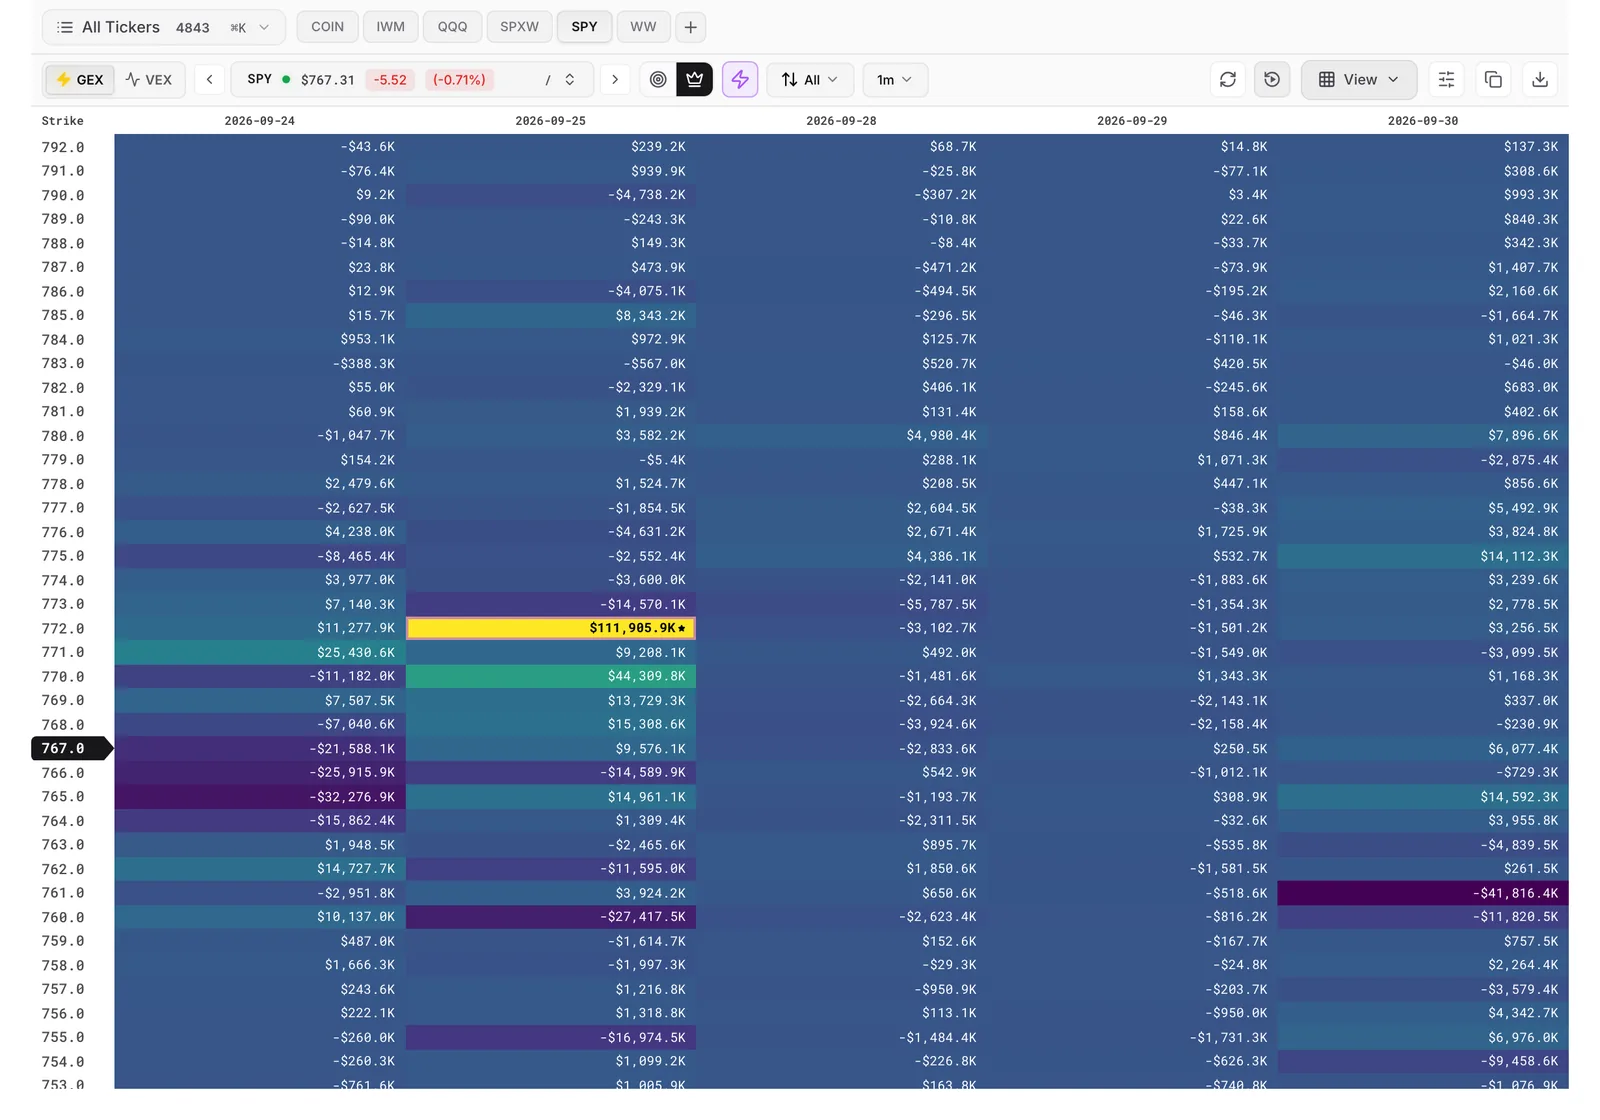
Type any letter to search, or step through your list with the arrow keys. Choose GEX for today's levels, or VEX for a multi-day view and days when volatility spikes.
Find the King, the floor and the ceiling
Rows are strikes, columns are expirations, and each cell is a node. The King is the starred cell. The biggest nodes just below and above price mark the edges of the range.
Check whether the board is building or melting
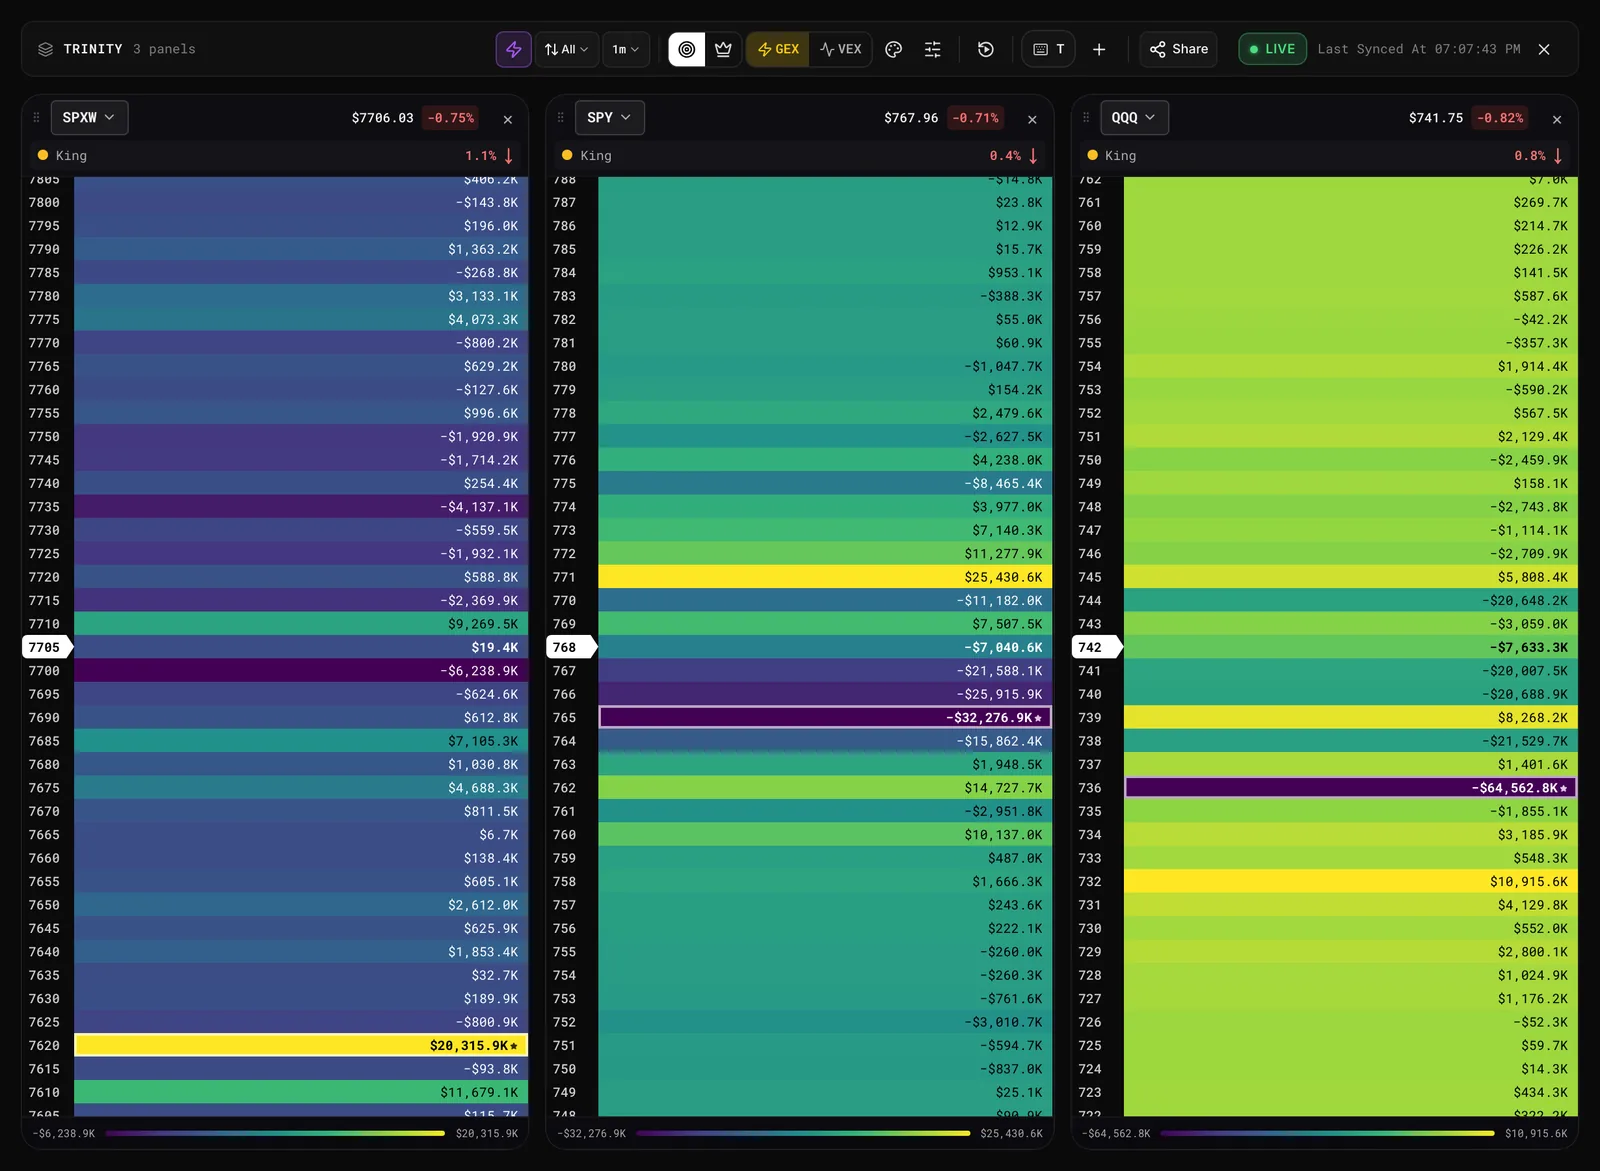
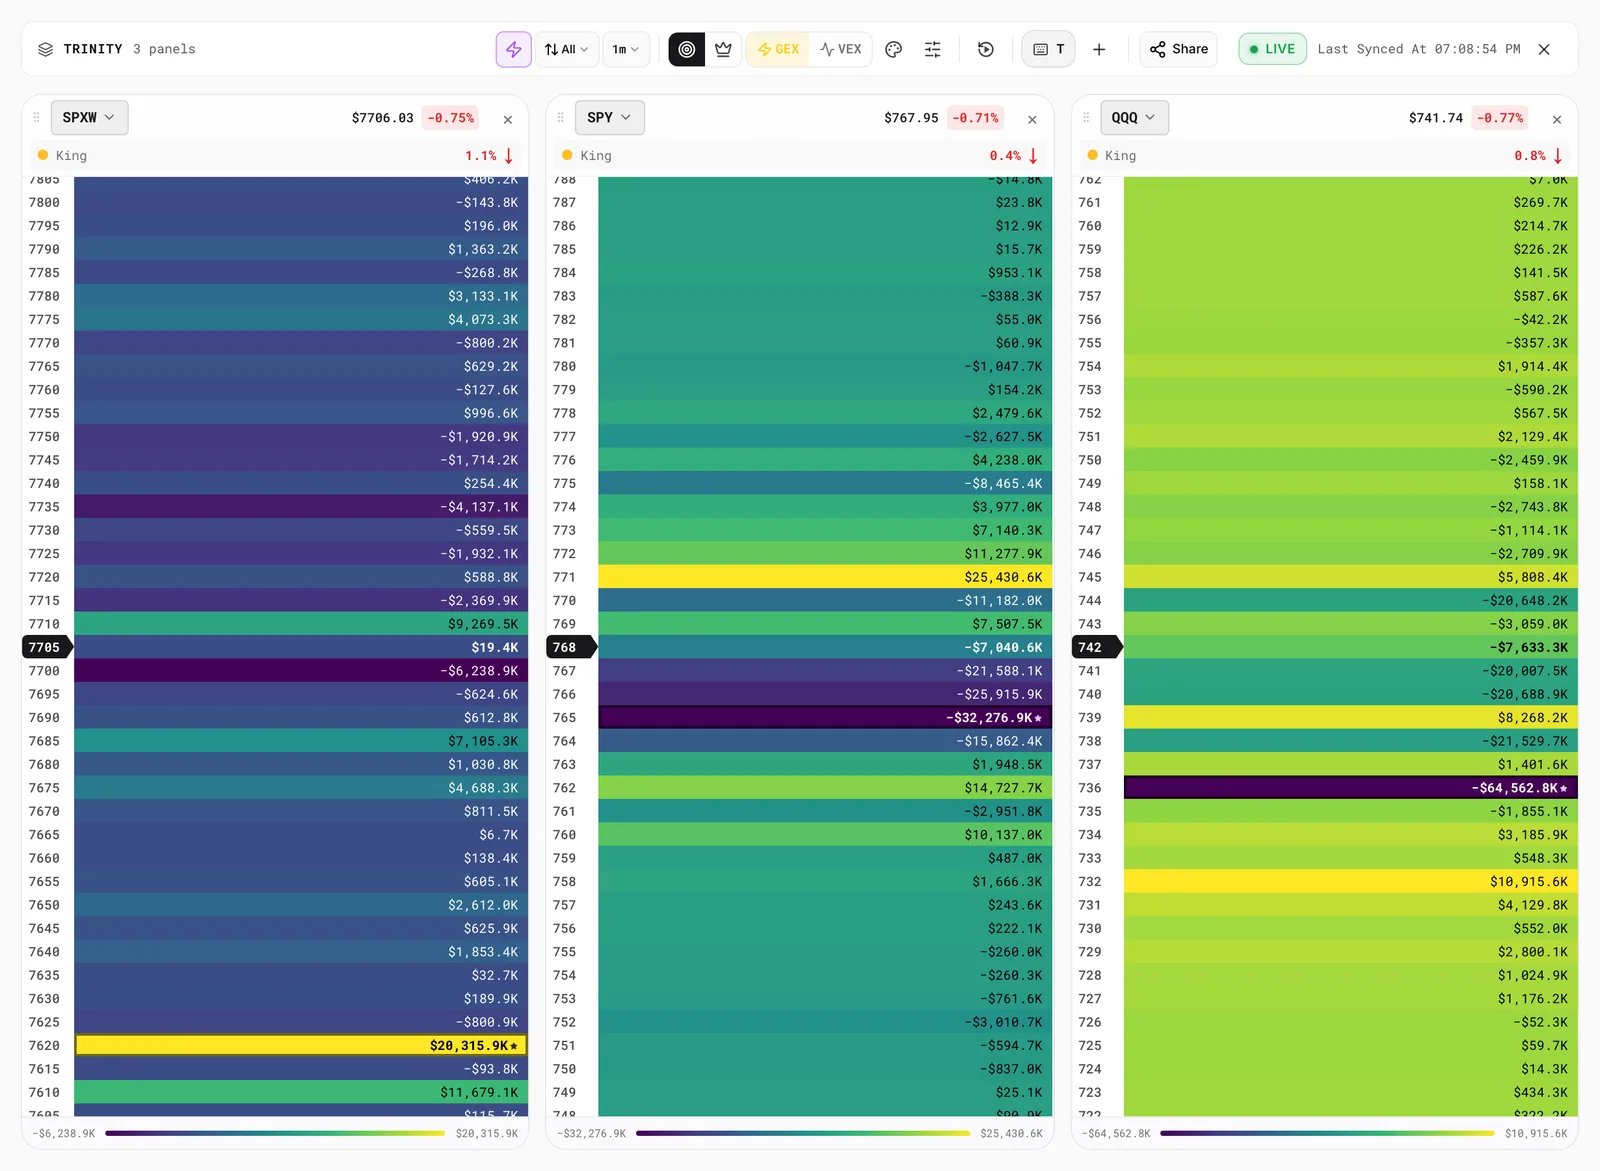
Turn on velocity to see which nodes are growing and which are shrinking, on timeframes from 1 minute to 1 day. For index trades, open Trinity to see whether SPX, SPY and QQQ agree.
Let alerts watch your levels
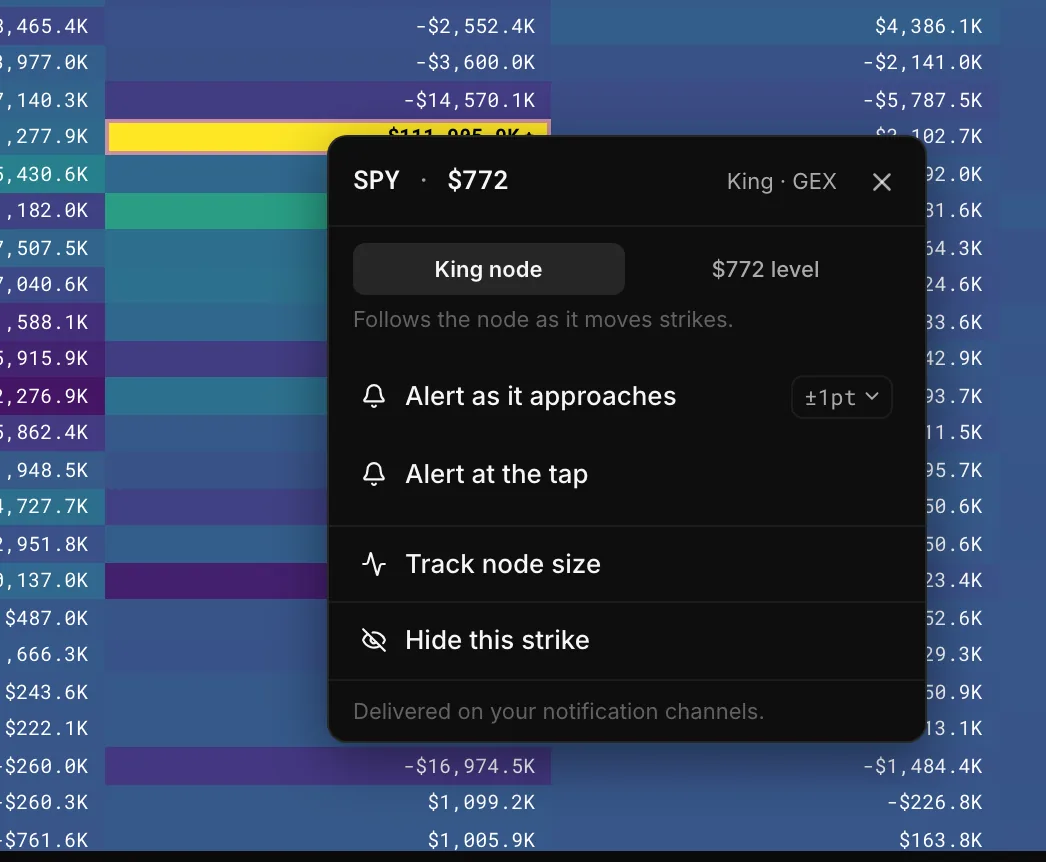
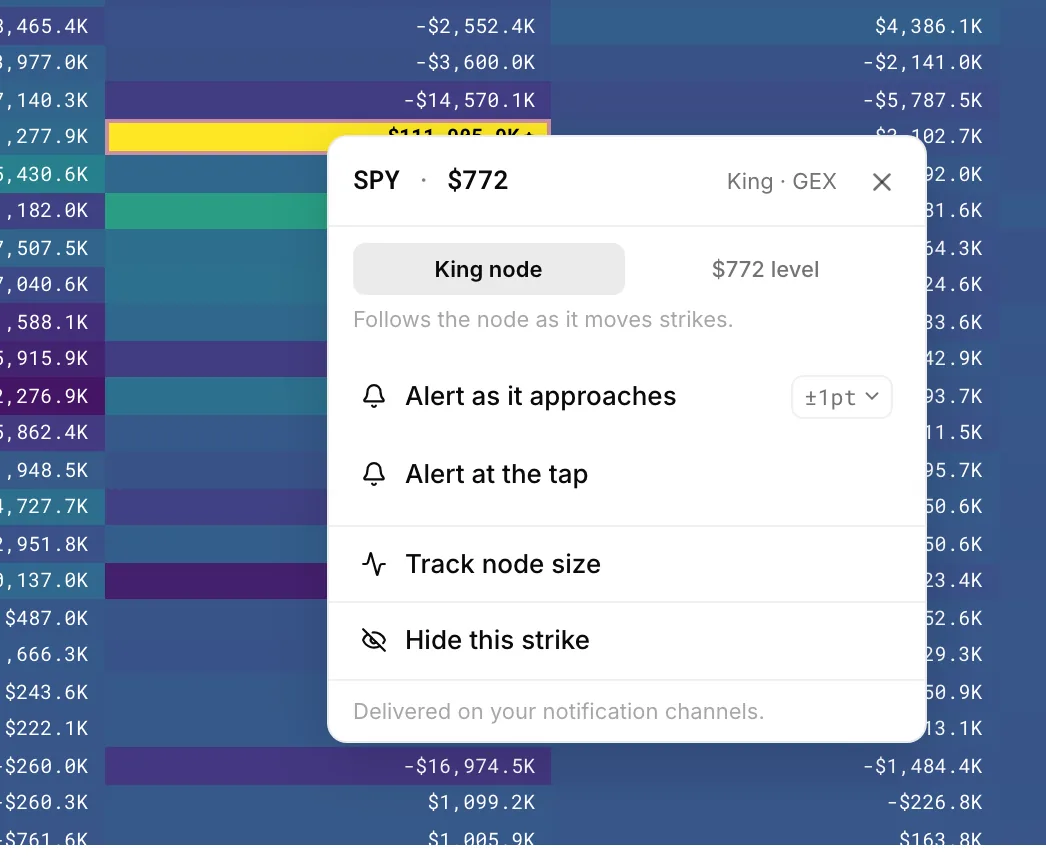
Right-click any node to get an alert as price approaches it or taps it, or to track how the node's size changes through the day.
01 / 04Pick a ticker and a view
Capabilities
What you can do with Heatseeker
Read GEX and VEX on one board
Switch between net gamma exposure for short-term levels and net vanna exposure for a longer view. The King and velocity follow the view you pick.
See SPX, SPY and QQQ together
Trinity Mode puts SPXW, SPY and QQQ side by side, and you can add panels up to six tickers. Your layout stays put after a refresh.
Set alerts straight from the board
Right-click a node to alert on approach or on the tap, with no price to type. Smart Alerts sets approach alerts on the King, Pika and Barney nodes across a whole watchlist in one click.
Watch levels build or melt
Velocity badges show which nodes are growing or shrinking. Movers lists the fastest changes, and the halo marks strikes where several timeframes agree.
Replay any past session
Run the board forward from any date and time to check whether price already reached a level and left, or to review how a session unfolded.
Cut the noise
Set the strike range and expirations you want, hide small strikes, and use Node % to read every value as a share of the King. Seven palettes, with colour-blind safe ones marked.
Every feature
Everything in Heatseeker
40 features · 7 groups
Ticker search
Get to the board you want in a keystroke: type any letter or / to search, or step through your list with the left and right arrow keys.
Guide: Ticker search (opens docs.skylit.ai in a new tab)Favourites
Keep the tickers you check every day one click away by starring them in the ticker list or using + on the favourites row.
Guide: Favourites (opens docs.skylit.ai in a new tab)Watchlists
Create, edit and search your watchlists without leaving the board from the watchlist picker (Cmd+K, or Ctrl+K on Windows).
Guide: Watchlists (opens docs.skylit.ai in a new tab)Ticker in the page address
A refresh or a link you share opens the same ticker you were on, because the ticker stays in the page address.
Guide: Ticker in the page address (opens docs.skylit.ai in a new tab)GEX and VEX
Read today's levels with GEX or a multi-day view with VEX, using the tabs at the top left of the board, and the King and velocity follow your pick.
Guide: GEX and VEX (opens docs.skylit.ai in a new tab)Keyboard shortcuts
See every shortcut in the app at once by pressing ? anywhere.
Guide: Keyboard shortcuts (opens docs.skylit.ai in a new tab)
The heatmap
See dealer exposure at every strike (rows) and every expiration (columns) on one board, with the strike nearest price highlighted, on Heatseeker > Heatmaps.
Guide: The heatmap (opens docs.skylit.ai in a new tab)King node
Spot the biggest node on the board at a glance, because it is marked with a star.
Guide: King node (opens docs.skylit.ai in a new tab)Named nodes
Know a node's role (King, Pika, Barney, Gatekeeper) without working it out yourself, because the right-click menu names it.
Guide: Named nodes (opens docs.skylit.ai in a new tab)Hover values
Read the exact value of any node by hovering over its cell.
Guide: Hover values (opens docs.skylit.ai in a new tab)Raw hover
Keep seeing the dollar value on hover even while the board shows percentages, with Raw hover in the Node % panel.
Guide: Raw hover (opens docs.skylit.ai in a new tab)Center on Spot Price and Center on King Node
Keep the board scrolled to price or to the King as the day moves, with the two centre buttons on the left of the control bar.
Guide: Center on Spot Price and Center on King Node (opens docs.skylit.ai in a new tab)
View Controls
Show as much or as little of the chain as you need: open View on the right of the control bar to pick a tight, normal or wide zoom and set Strike Range and Expirations.
Guide: View Controls (opens docs.skylit.ai in a new tab)Hide small strikes
Calm a noisy board with Hide strikes under a value, or hide strikes with no value in the columns shown, both in View Controls.
Guide: Hide small strikes (opens docs.skylit.ai in a new tab)Hide this strike
Remove a single row you do not need from its right-click menu, and bring it back from the hidden-strikes chip or View Controls.
Guide: Hide this strike (opens docs.skylit.ai in a new tab)Node %
See at a glance how big each node is next to the King: open the sliders button beside View and pick the Off, Focus or King preset, or read values as % King.
Guide: Node % (opens docs.skylit.ai in a new tab)Low nodes
Push small nodes into the background with Hide, Dim or Fade for everything below a share of the King you choose, in the Node % panel.
Guide: Low nodes (opens docs.skylit.ai in a new tab)Palettes
Pick from seven colour maps in the Node % panel, with the colour-blind safe ones marked and cividis recommended.
Guide: Palettes (opens docs.skylit.ai in a new tab)Saved presets
Save a Node % combination under a name and it follows you across devices.
Guide: Saved presets (opens docs.skylit.ai in a new tab)
Velocity
See which levels are building and which are melting as price approaches: click the lightning button and pick a timeframe from 1 min to 1 day.
Guide: Velocity (opens docs.skylit.ai in a new tab)Increasing and Decreasing filter
Show only growing or only shrinking nodes with the direction menu beside velocity.
Guide: Increasing and Decreasing filter (opens docs.skylit.ai in a new tab)Movers
List the fastest-growing and fastest-shrinking nodes, plus your tracked nodes, from the Movers button that appears once velocity is on.
Guide: Movers (opens docs.skylit.ai in a new tab)Halo
Mark strikes where velocity agrees across the timeframes you pick, with Halo · must agree in the timeframe menu.
Guide: Halo (opens docs.skylit.ai in a new tab)Replay
Check whether price already reached a level and left, or review a past session, by running the board forward from any date and time with Shift+R.
Guide: Replay (opens docs.skylit.ai in a new tab)Replay jumps
Jump straight to NOON, or to NY OPEN on index tickers, from the replay picker, with times always in Eastern.
Guide: Replay jumps (opens docs.skylit.ai in a new tab)
Trinity Mode
See whether SPXW, SPY and QQQ agree by reading them side by side, from Heatseeker > Trinity Mode or Shift+T on the Heatmaps page.
Guide: Trinity Mode (opens docs.skylit.ai in a new tab)Add ticker panel
Add your own tickers with the + button, up to six panels, and your layout stays put after a refresh.
Guide: Add ticker panel (opens docs.skylit.ai in a new tab)The full toolbar in Trinity
Use GEX and VEX, velocity, the centre buttons, Node % and replay across all three indexes from Trinity's own control bar.
Guide: The full toolbar in Trinity (opens docs.skylit.ai in a new tab)Trinity colour scale
Choose whether Trinity shades by the first column or by view settings, so the colours suit how you compare the panels.
Guide: Trinity colour scale (opens docs.skylit.ai in a new tab)
Alert as it approaches
Get a heads-up before price reaches a node, with no price to type: right-click the cell and set how close with the margin setting.
Guide: Alert as it approaches (opens docs.skylit.ai in a new tab)Alert at the tap
Get one alert when price touches a node, set from the same right-click menu.
Guide: Alert at the tap (opens docs.skylit.ai in a new tab)Role or $level alerts
Choose whether an alert follows the node's role, such as King node, even if it moves strike, or stays on the exact $level.
Guide: Role or $level alerts (opens docs.skylit.ai in a new tab)Track node size
Watch a node build or melt through the day by adding it to your tracked list from its right-click menu, then checking the Tracked tab.
Guide: Track node size (opens docs.skylit.ai in a new tab)Create Alert
Build an alert by hand on Heatseeker > Alerts, for chosen tickers or a watchlist, on a node type or a custom price level.
Guide: Create Alert (opens docs.skylit.ai in a new tab)Smart Alerts
Set approach alerts on the King, Pika and Barney nodes, on GEX and VEX, for every ticker in a watchlist in one click from Heatseeker > Alerts.
Guide: Smart Alerts (opens docs.skylit.ai in a new tab)
Copy image and Save image
Put the board in your trading journal or a Discord post by copying it to your clipboard or saving it as a PNG from the right end of the control bar.
Guide: Copy image and Save image (opens docs.skylit.ai in a new tab)Heatseeker on Atlas
Read levels against candles, because Heatseeker nodes show on the Atlas chart as orbs, and Shift+H or Shift+T opens a heatmap or Trinity panel beside it.
Guide: Heatseeker on Atlas (opens docs.skylit.ai in a new tab)Ask Talon
Get a plain-English read of the board you are looking at, or of another ticker, from the Aegis panel (click the bubble or press Cmd+\).
Guide: Ask Talon (opens docs.skylit.ai in a new tab)Talon commands
Pull levels, Trinity agreement or a setup scan with /levels, /trinity, /talon and /watchlist, and flow or context with /flow, /darkpool, /metrics, /market and /earnings.
Guide: Talon commands (opens docs.skylit.ai in a new tab)On your phone
Use the same board on a phone: the control bar sits at the top and scrolls sideways, and a long-press on any cell opens the node menu.
Guide: On your phone (opens docs.skylit.ai in a new tab)
Why traders pay for it
What Heatseeker puts in your hands
What's uniquely in hand
Dealer gamma and vanna exposure at every strike and expiration, updated live, with the King node starred. It is the part of the market a price chart doesn't show.
Time it gives back
The levels that matter sit on one board, velocity shows which are building or melting, and alerts watch them for you.
What it replaces
A chart full of hand-drawn lines, and exposure you would otherwise rebuild from the options chain yourself.
Heatseeker Bot maps in Discord on every plan. The index complex in the web app on Initiate, and 3,500+ tickers on Pro.Market data licensed via NASDAQ, CBOE and OPRA.
Pairs with
Heatseeker with the rest of Skylit
Atlas
Heatseeker nodes appear on the Atlas chart as orbs, so you can read levels against candles. Open a heatmap or Trinity panel beside the chart with a keystroke.
Flowseeker
Flowseeker shows what traders are doing; Heatseeker shows where dealers are positioned. Some traders watch for flow arriving at a large node.
Talon
Ask Talon for levels, Trinity agreement or a setup scan in plain English without leaving the heatmap. It reads the same board you are looking at.



Your ticker survives a refresh(in the guide, opens docs.skylit.ai in a new tab)
The ticker you pick now stays in the page address, so a refresh or a shared link opens that same ticker instead of SPXW.
Steadier Trinity ladders(in the guide, opens docs.skylit.ai in a new tab)
Trinity columns keep their full strike range after you switch tabs, rows stay aligned when the browser is zoomed out, and resizing re-centres the board.
Negative values in Trinity read cleanly(in the guide, opens docs.skylit.ai in a new tab)
The minus sign on Trinity values matches the digits' width and height again, so you can spot negative nodes at a glance.
Does the heatmap tell me whether price goes up or down?
No. Heatseeker shows where dealers are positioned; it does not predict direction. A positive node is not bullish and a negative node is not bearish. The sign describes how price tends to move through a level: positive nodes give smoother reactions, negative nodes give faster, wickier moves. Many traders wait for price action to confirm a level.
When do I use GEX and when do I use VEX?
GEX shows short-term dealer positioning. Day traders use it for intraday levels, watching the same-day column on indexes and the nearest expiration on single names. VEX shows positioning that shifts with implied volatility, so traders use it for a view of roughly five days and out, and on days when volatility spikes.
What is the King node?
The biggest node on the board, positive or negative, marked with a star. Skylit's lessons teach it as a level price is often drawn to, especially into the close. That is teaching, not a tested result.
Why does the same strike look different in Trinity and on the single-ticker board?
Trinity has its own colour-scale setting, so the same strike can be shaded differently. The values are the same. Read the number, not the colour.
Is there a flag for delivered versus fresh nodes?
The board does not flag them. Use replay to check whether price already reached a level and left before you rely on it.
Does Heatseeker send trade signals?
No. Heatseeker is context, not a trigger. It shows where dealers are positioned, and the alerts you set fire on levels you choose. It never tells you what to trade.

Stop guessing which levels matter.
See dealer positioning at every strike and expiration, and plan around it before price arrives.