Atlas: charting by Skylit
See your levels before price gets there.
One live chart that shows where dealer positioning, options flow and dark-pool levels line up with price. Your alerts, drawings and positions sit on the same screen.
The problem
Your chart shows price. The options market is somewhere else.
- The levels that matter are on one screen, the chart is on another, and you're flipping tabs when price moves.
- A dark-pool level or a burst of flow looks important, but you can't tell if it lines up with anything.
- By the time you've marked the level by hand, price is already there.
With Atlas
One chart. Every layer of the read.
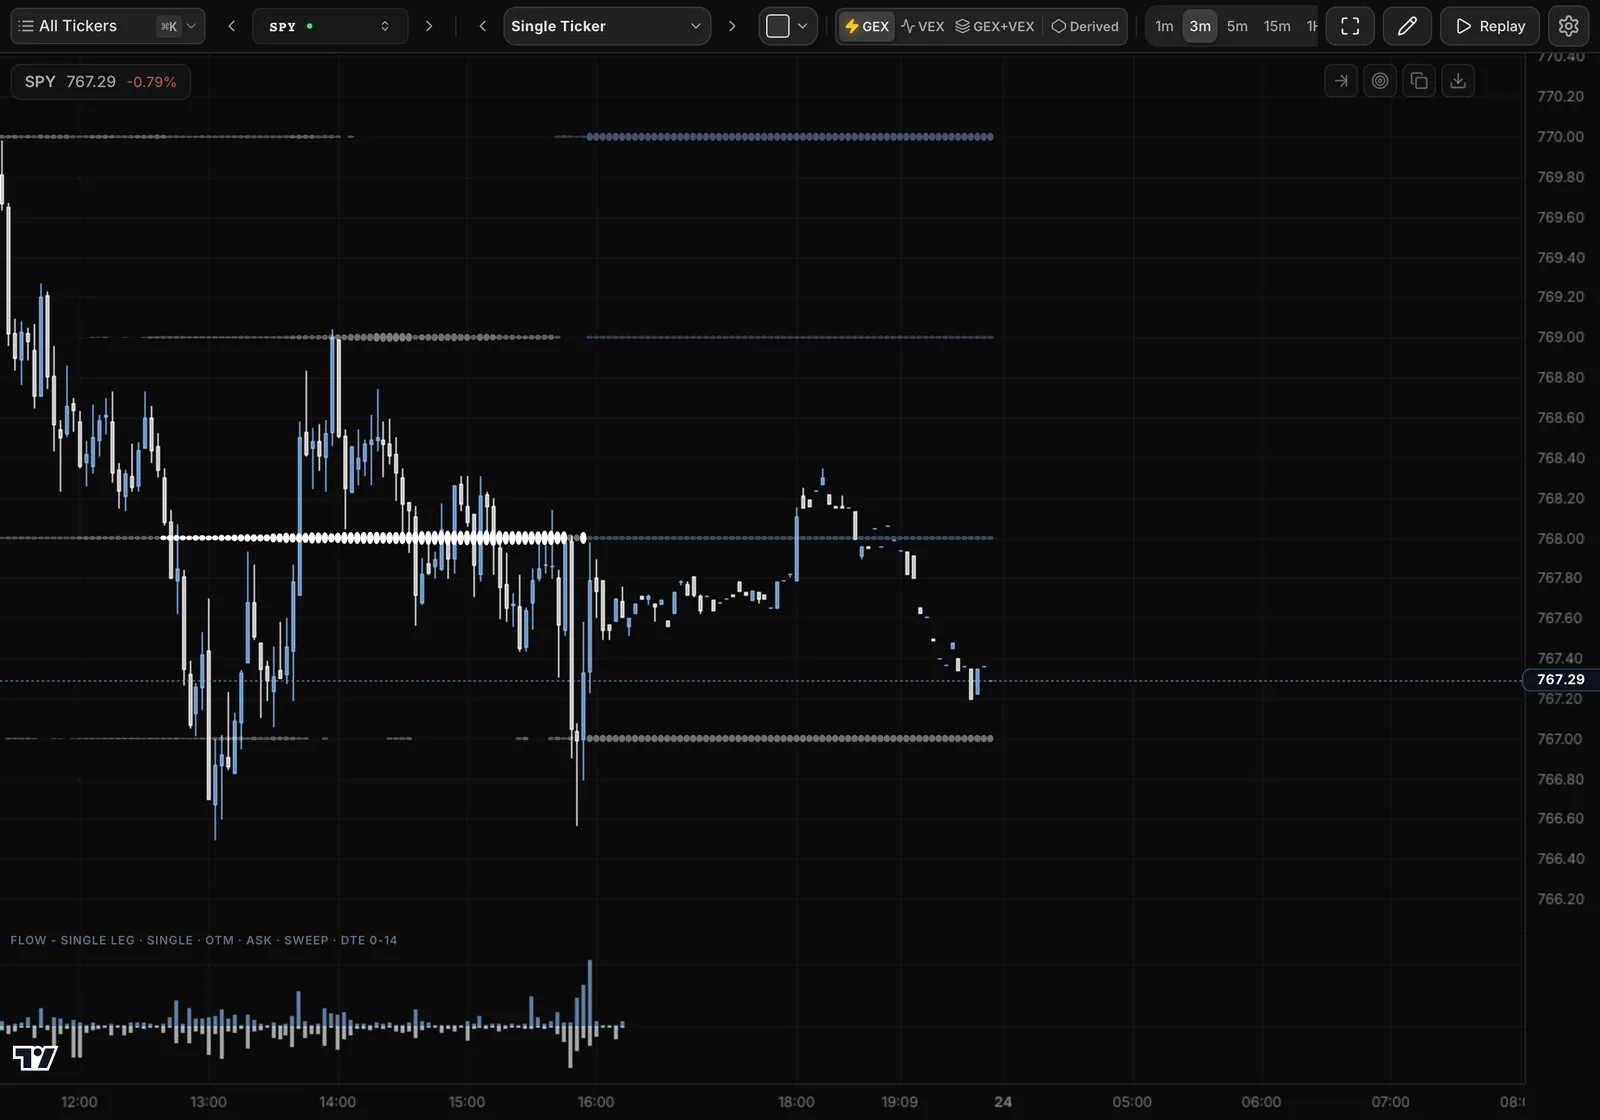
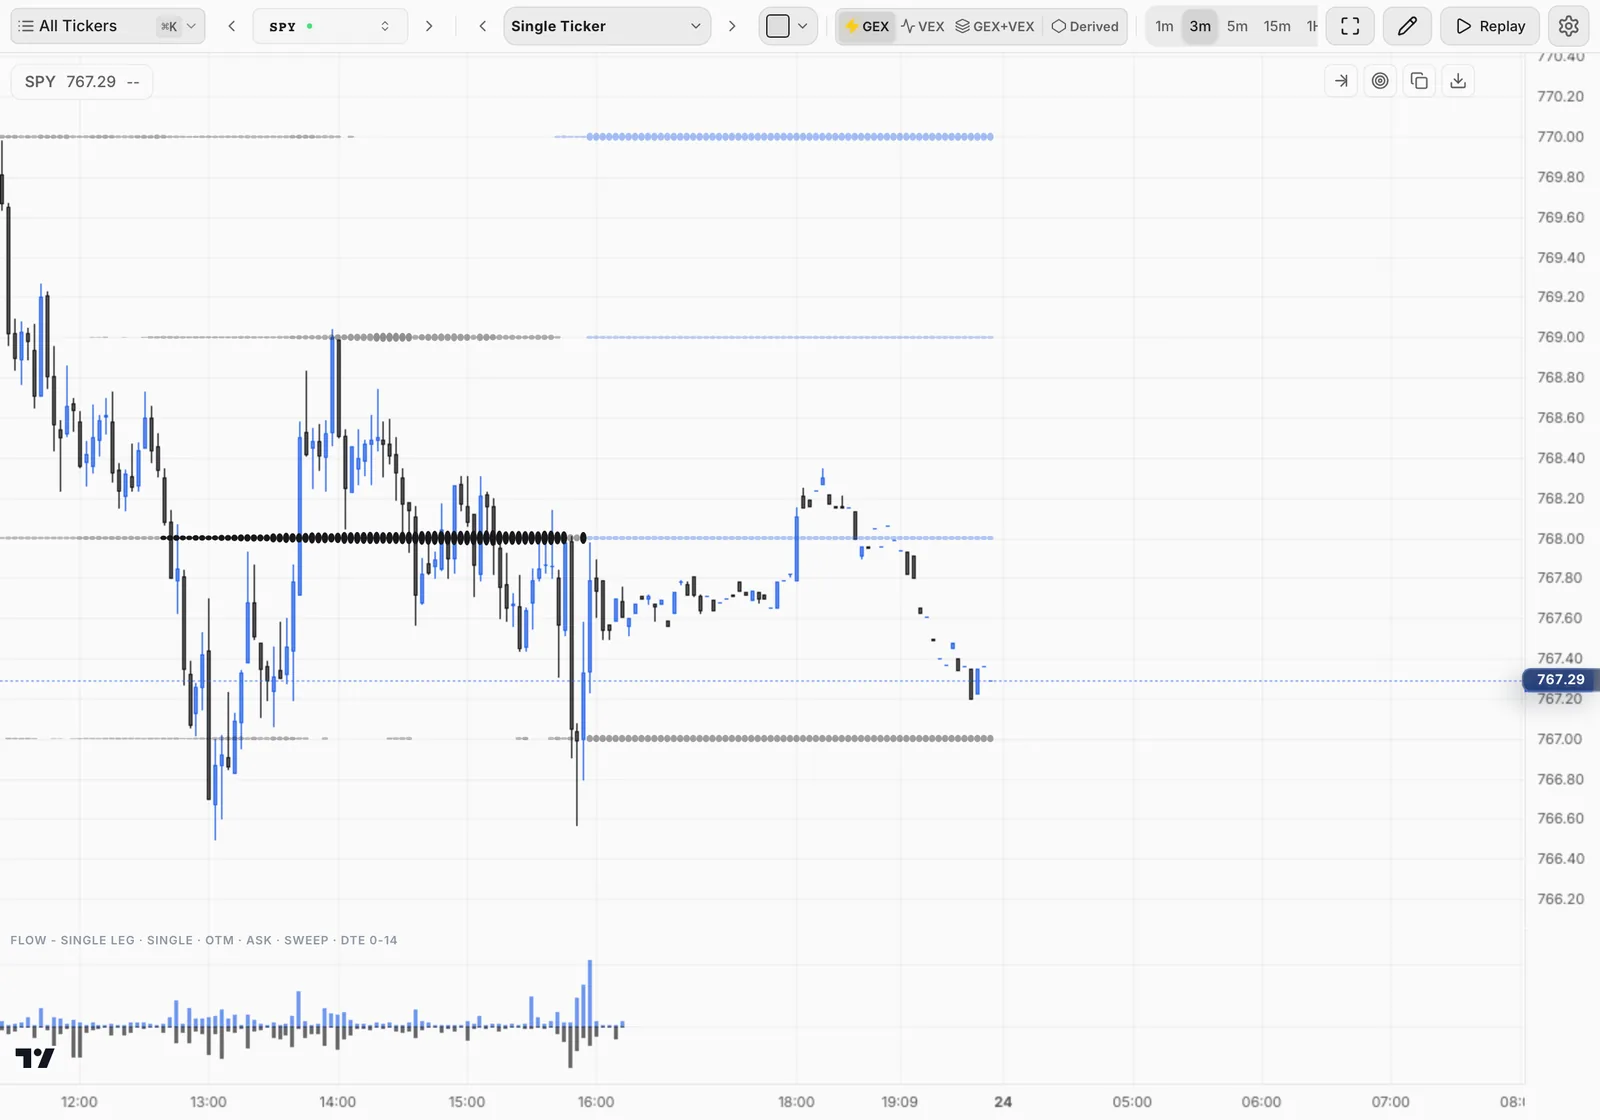
Atlas draws the strikes where dealer hedging is concentrated right on the candles, bar by bar, next to options flow and dark-pool levels. You see where several reasons stack at one price before price arrives. Atlas never calls direction: it shows where the levels are, and you judge what price does there.
How it works
Atlas, step by step
Pick your symbol and horizon
Chart stocks, ETFs, SPXW or futures such as ES1 and NQ1. In Settings > Exposure, set Expirations to how long you hold: Front for 0DTE and scalps, a wider window such as To Friday or To OPEX for swings.
Find the King Node
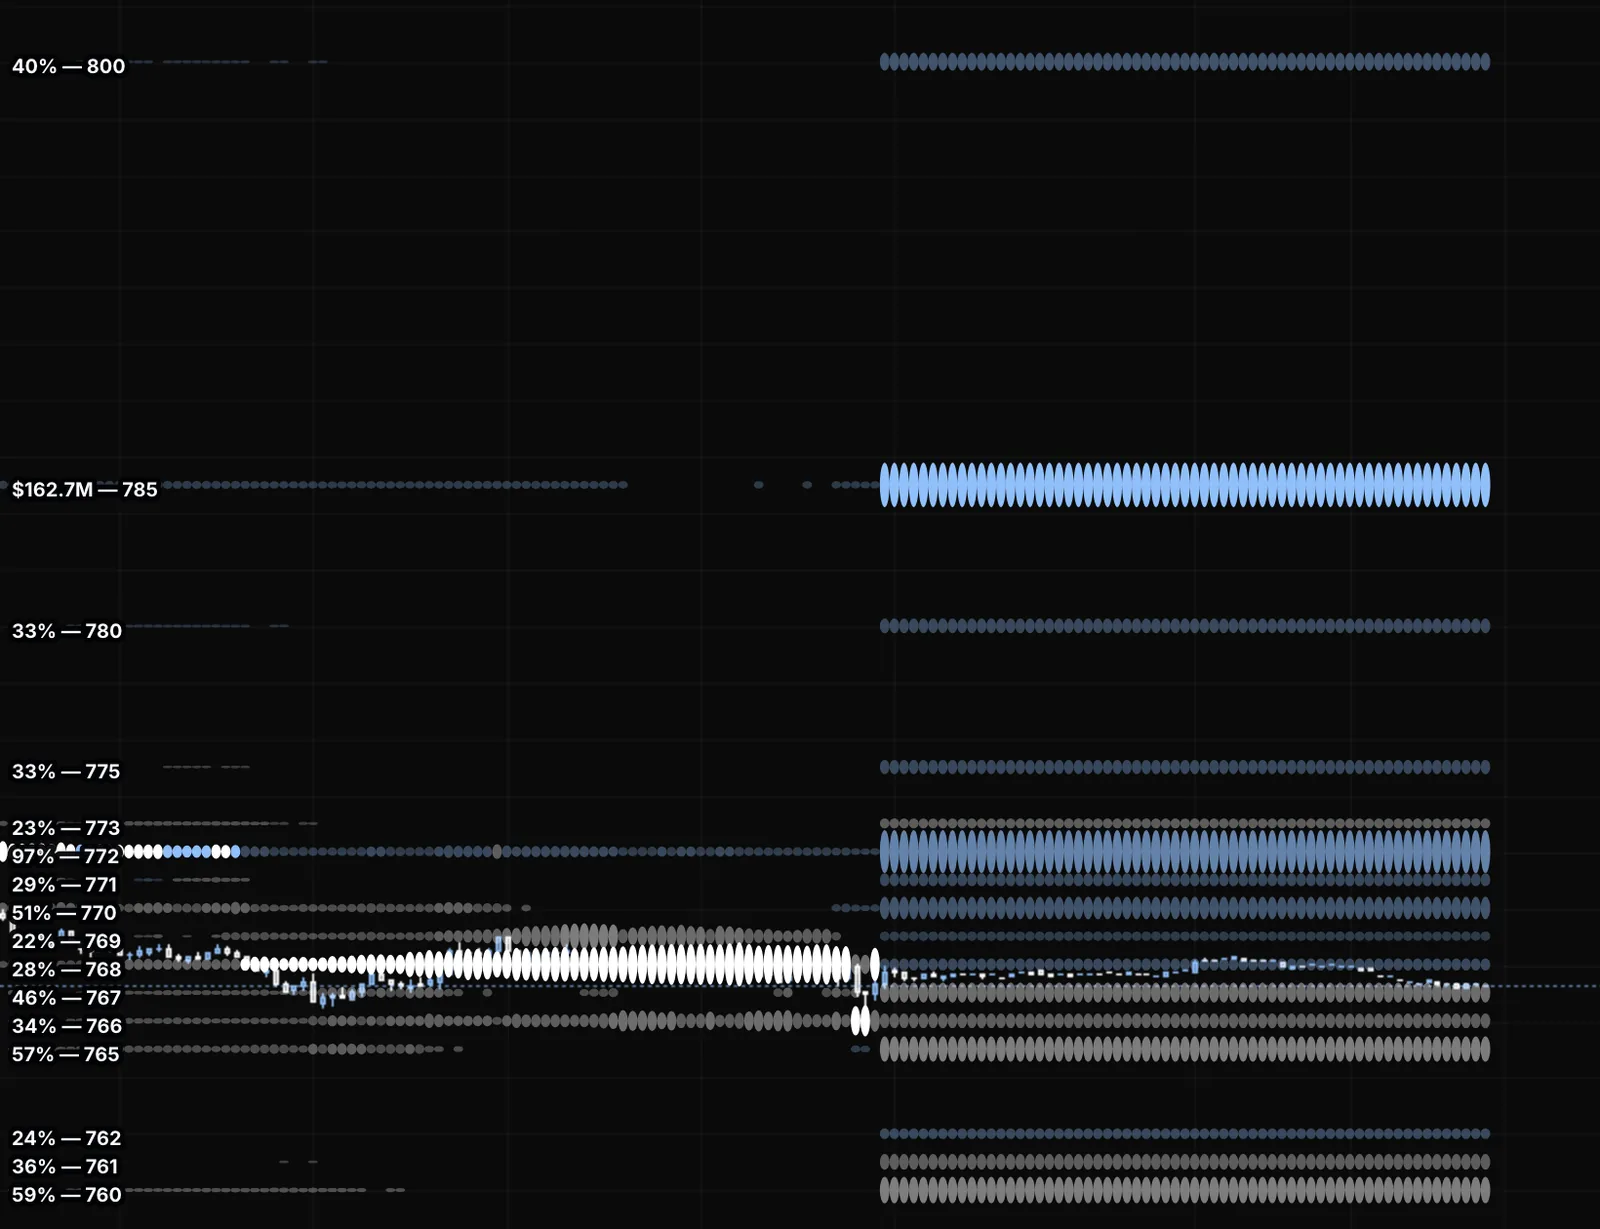
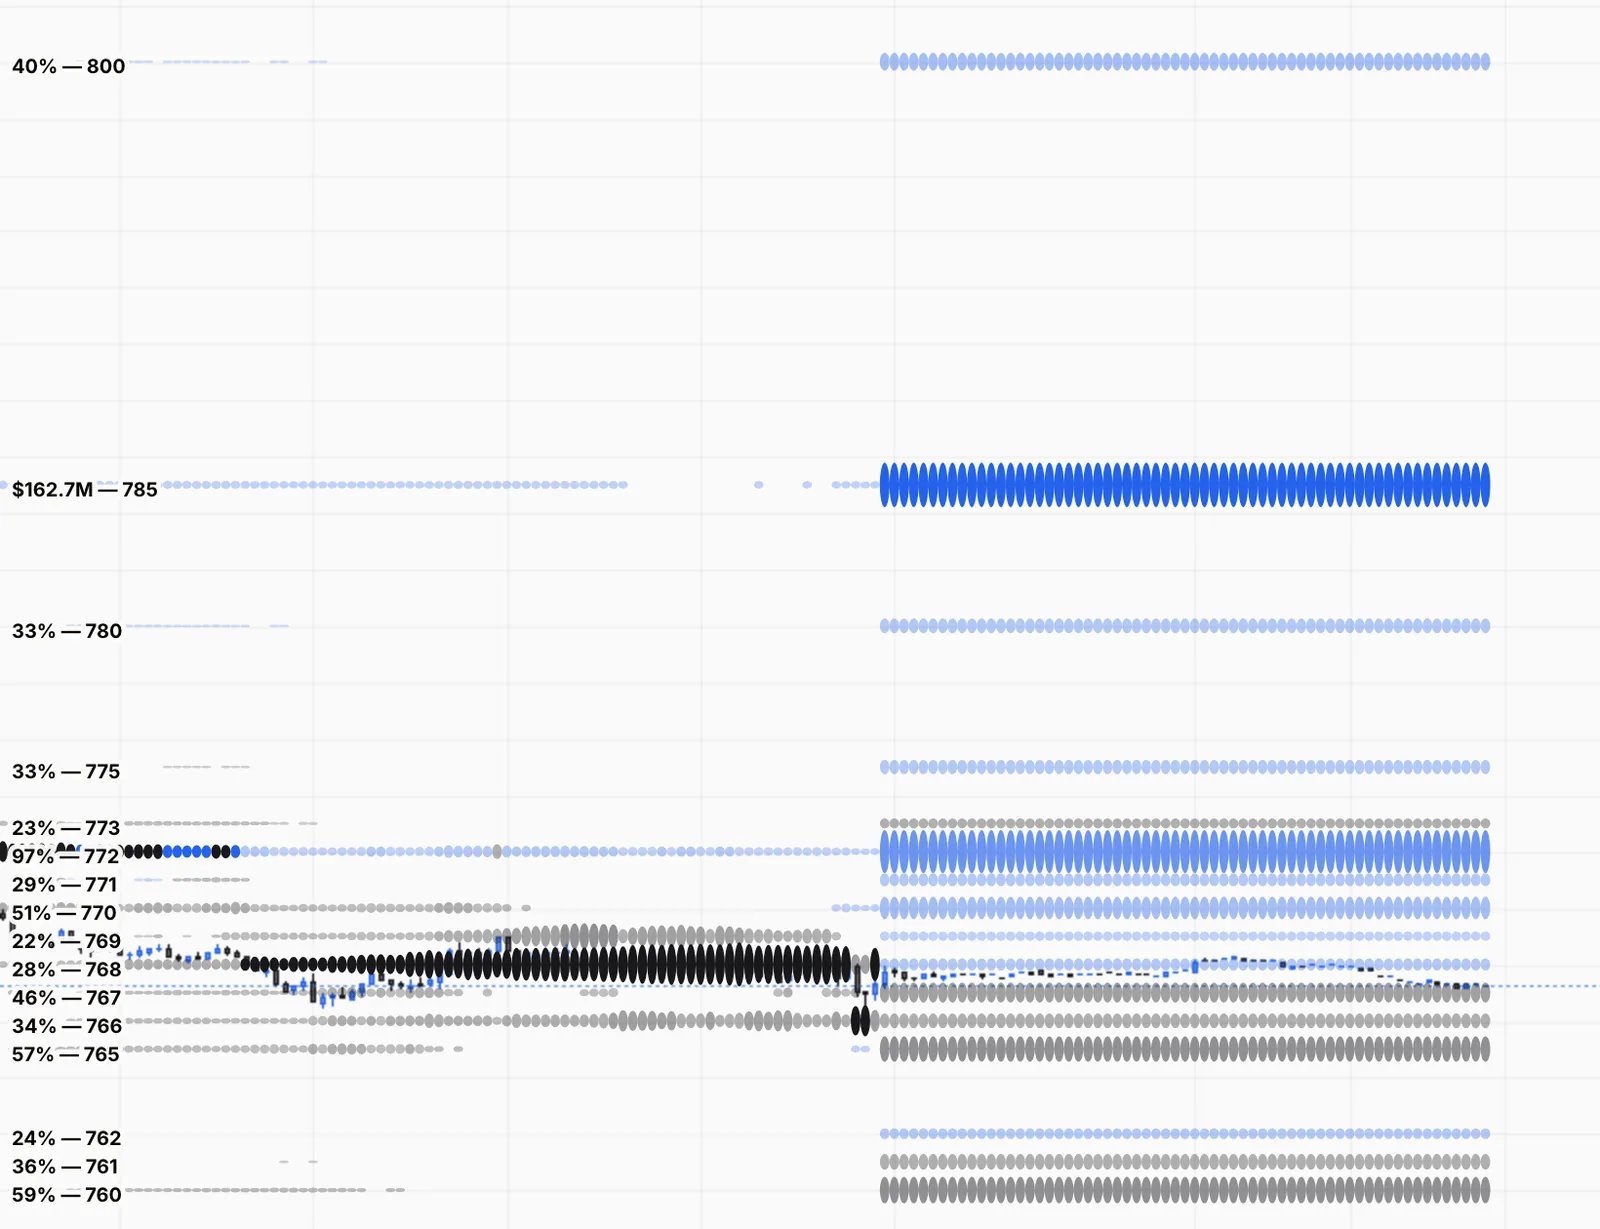
Orbs mark the strikes where dealer positioning is concentrated. Bigger and brighter means stronger, and the strongest is the King Node. Turn on Node labels to see each strike and its size.
Look for confluence
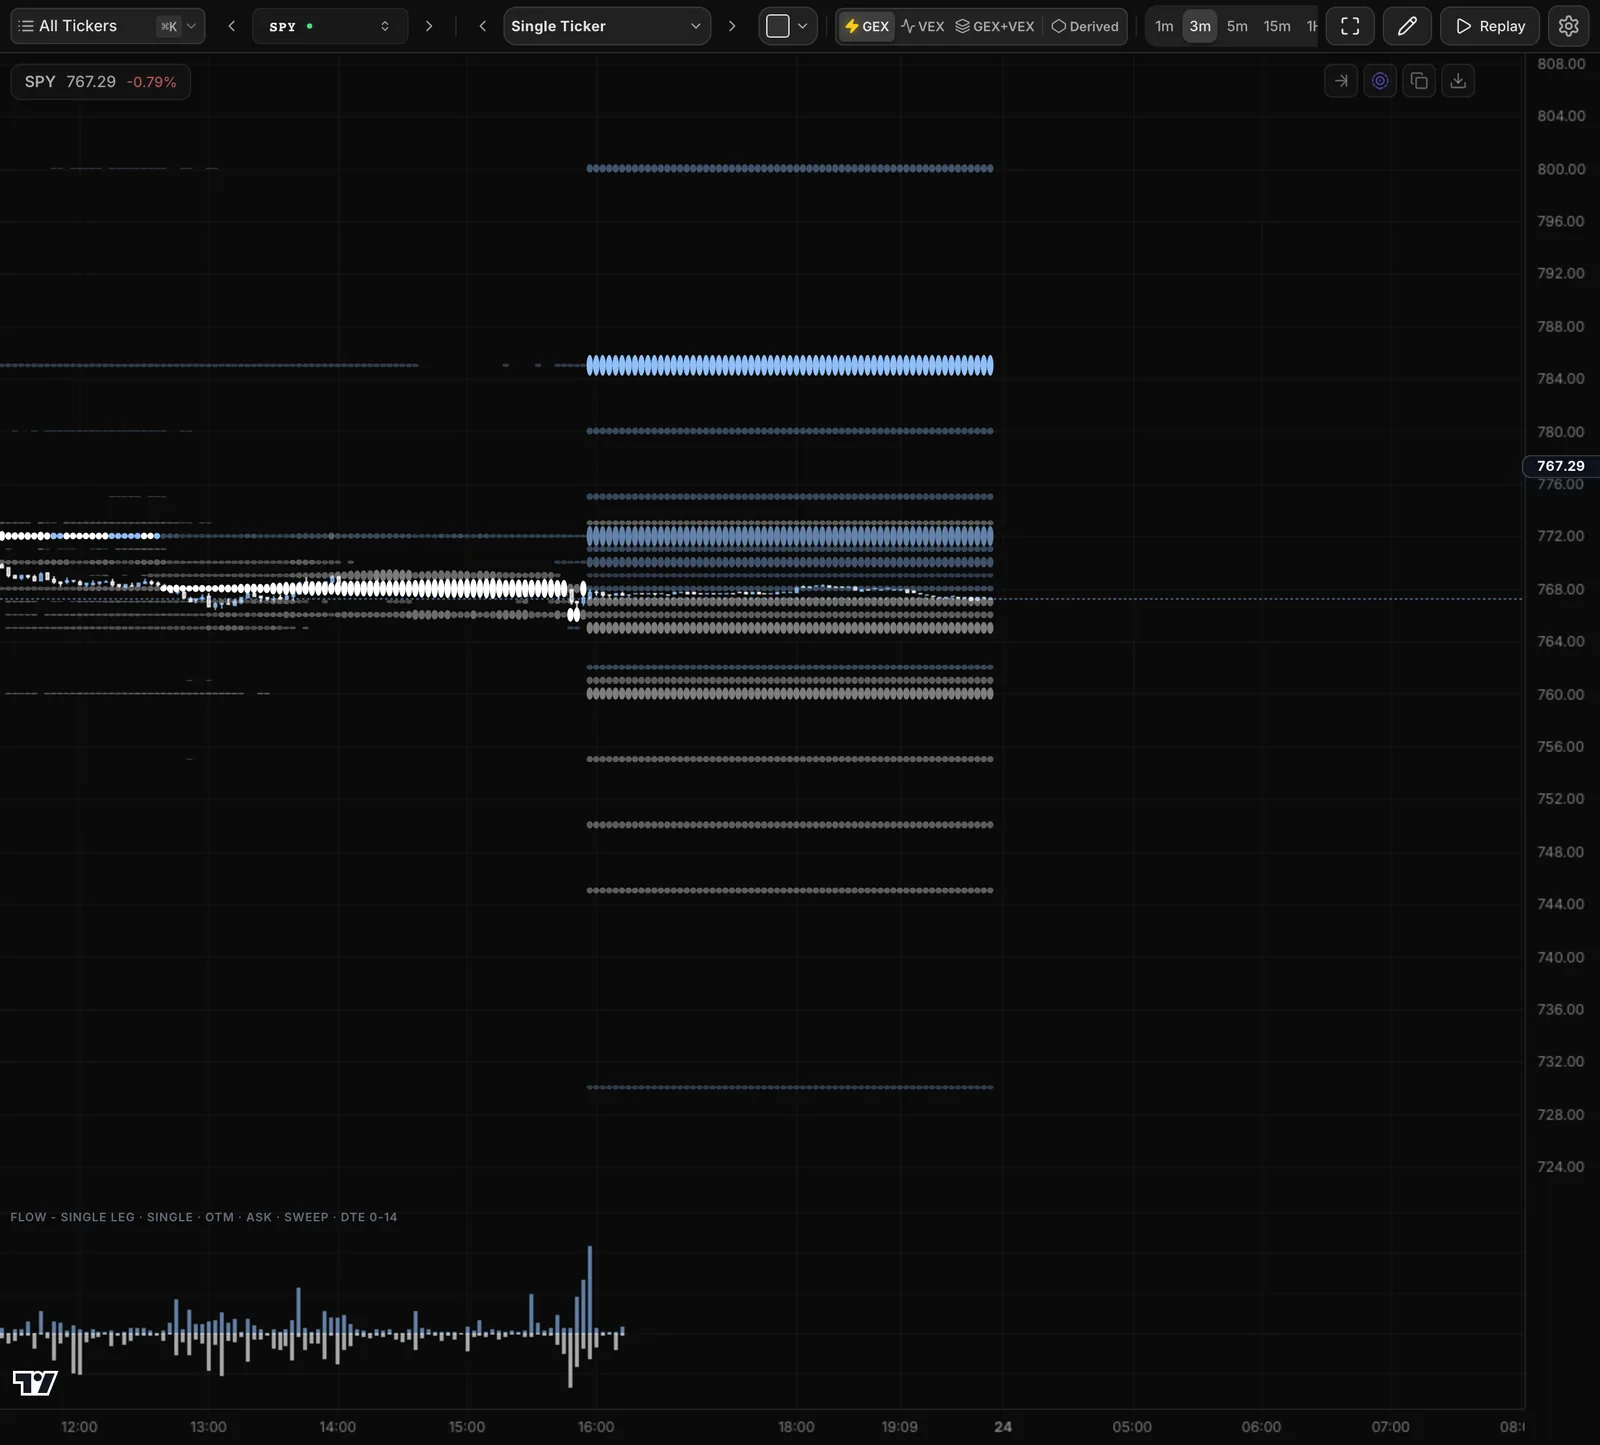
Add Flow and Dark Pool from Settings > Add. Traders usually rate a node higher when it sits on a dark-pool level, a VWAP band or a cluster of flow bars.
Get told when price arrives
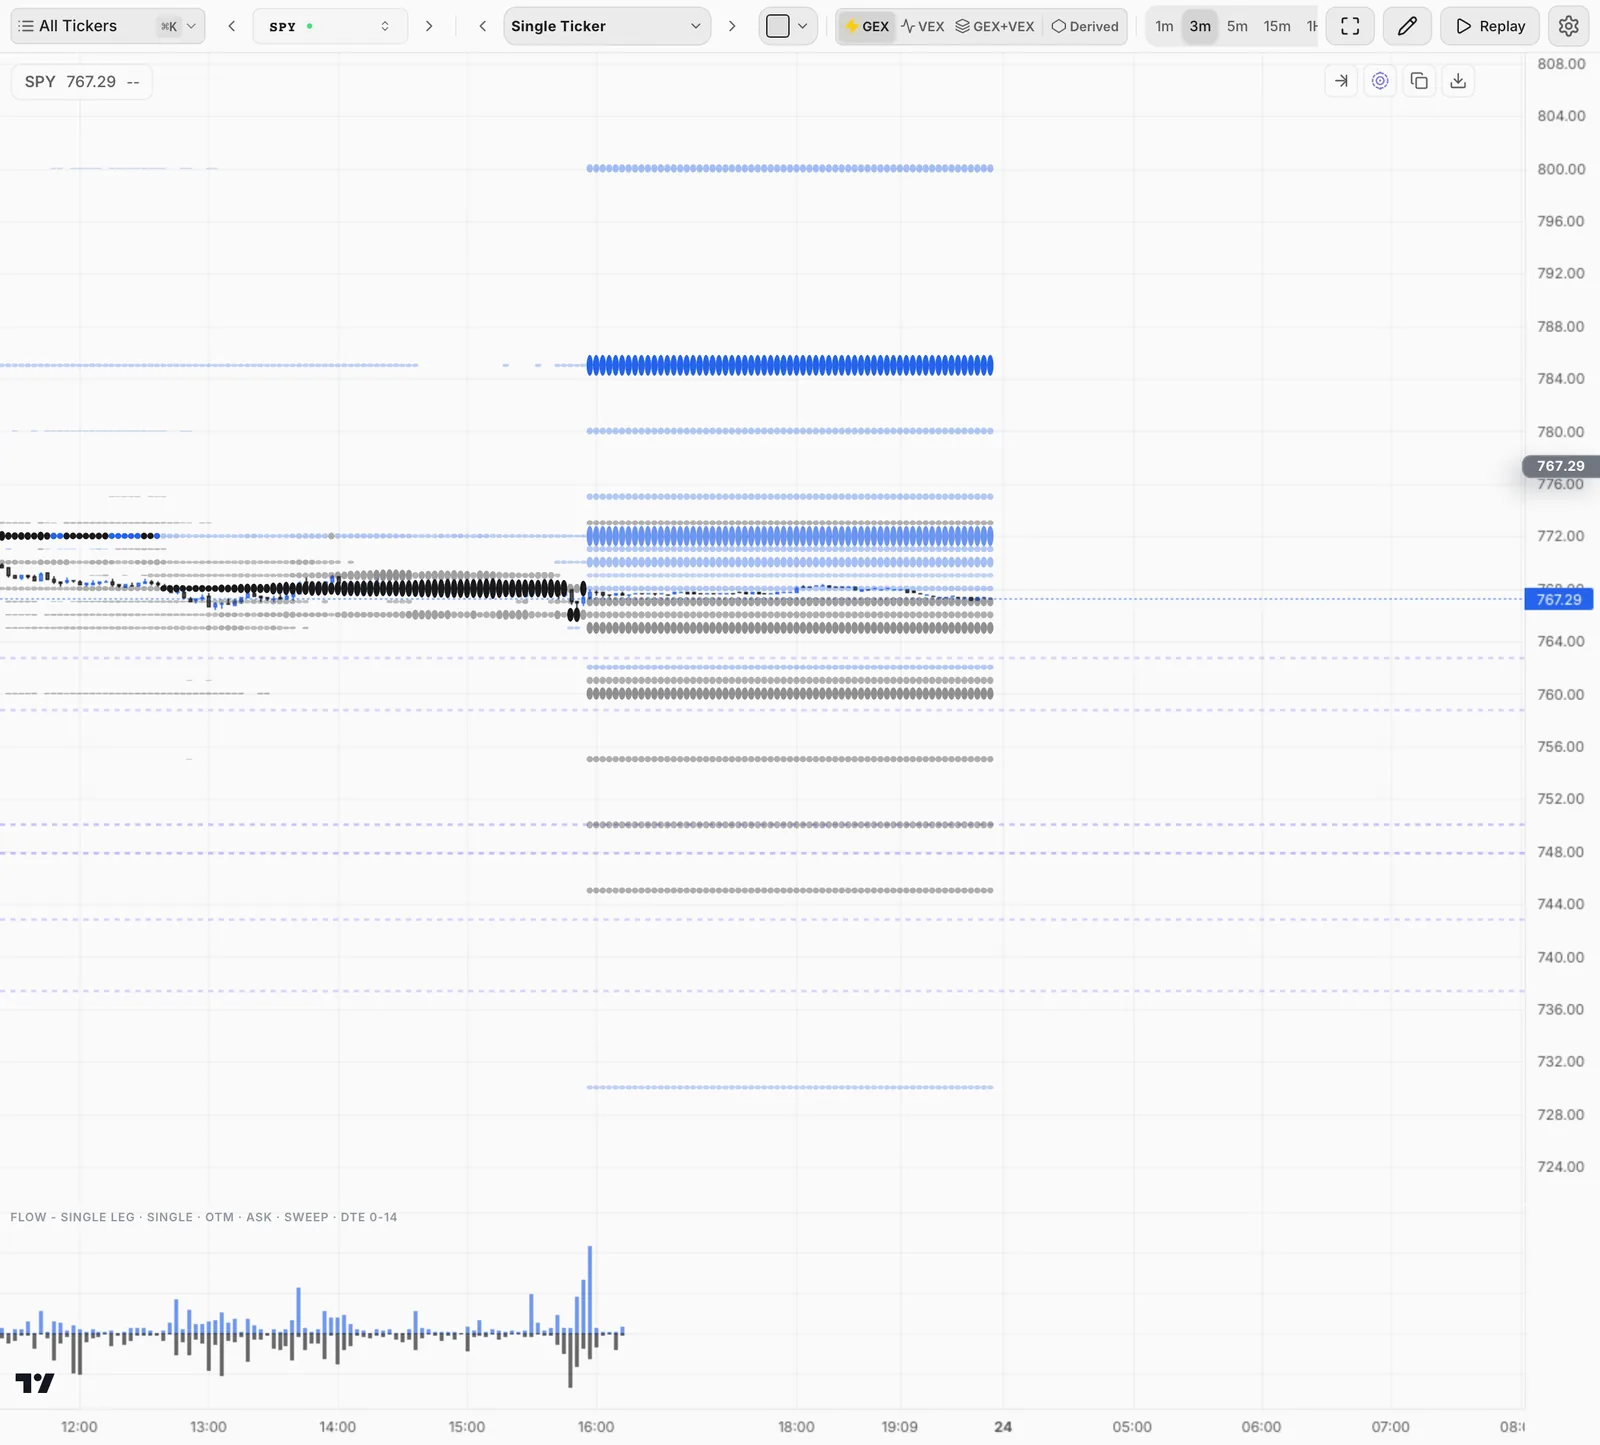
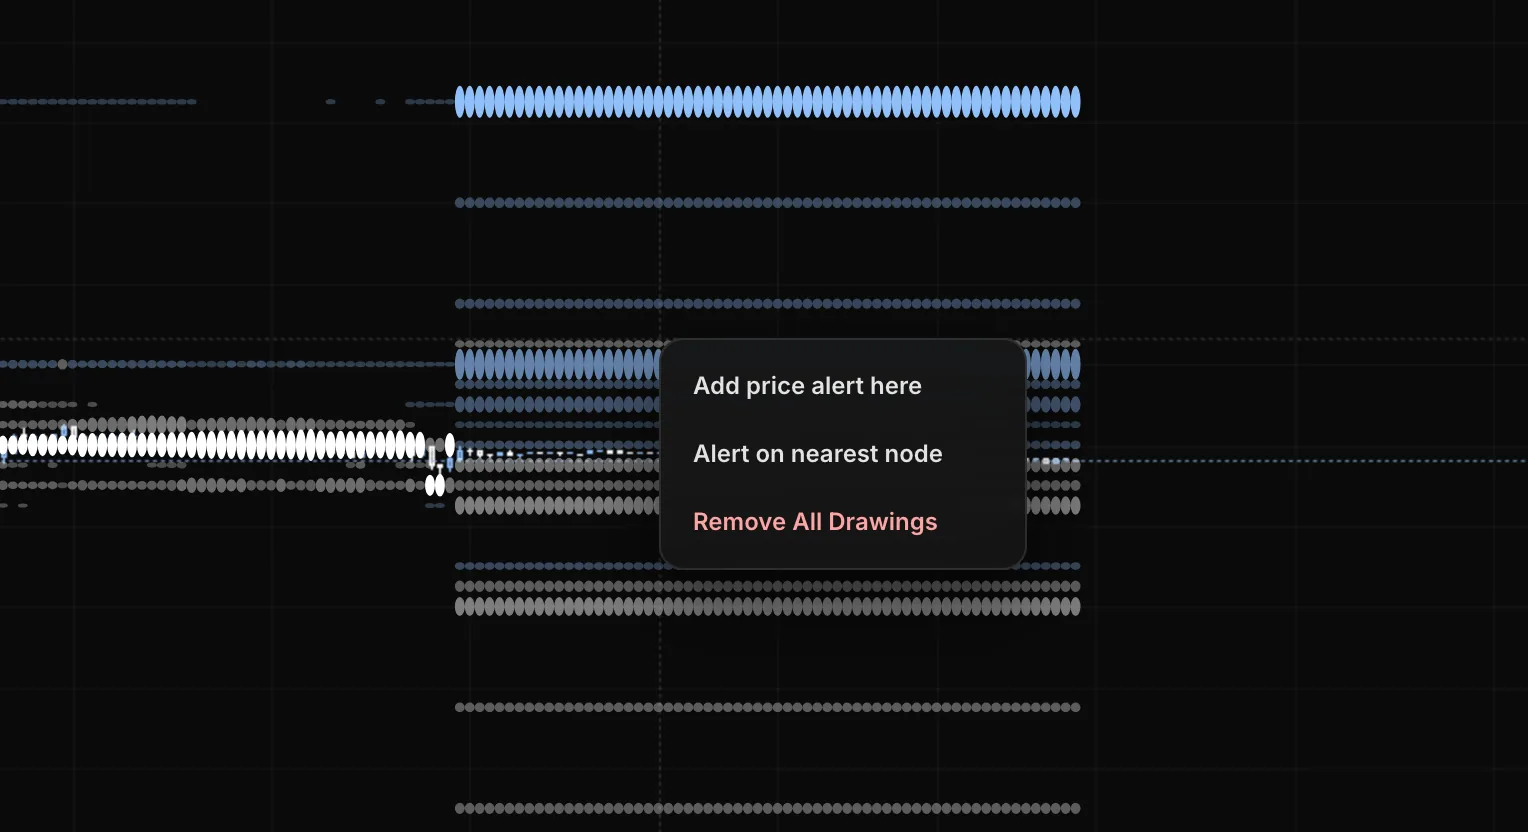
Right-click the chart to set a price alert, or alert on the nearest node. Then watch what price does at the level.
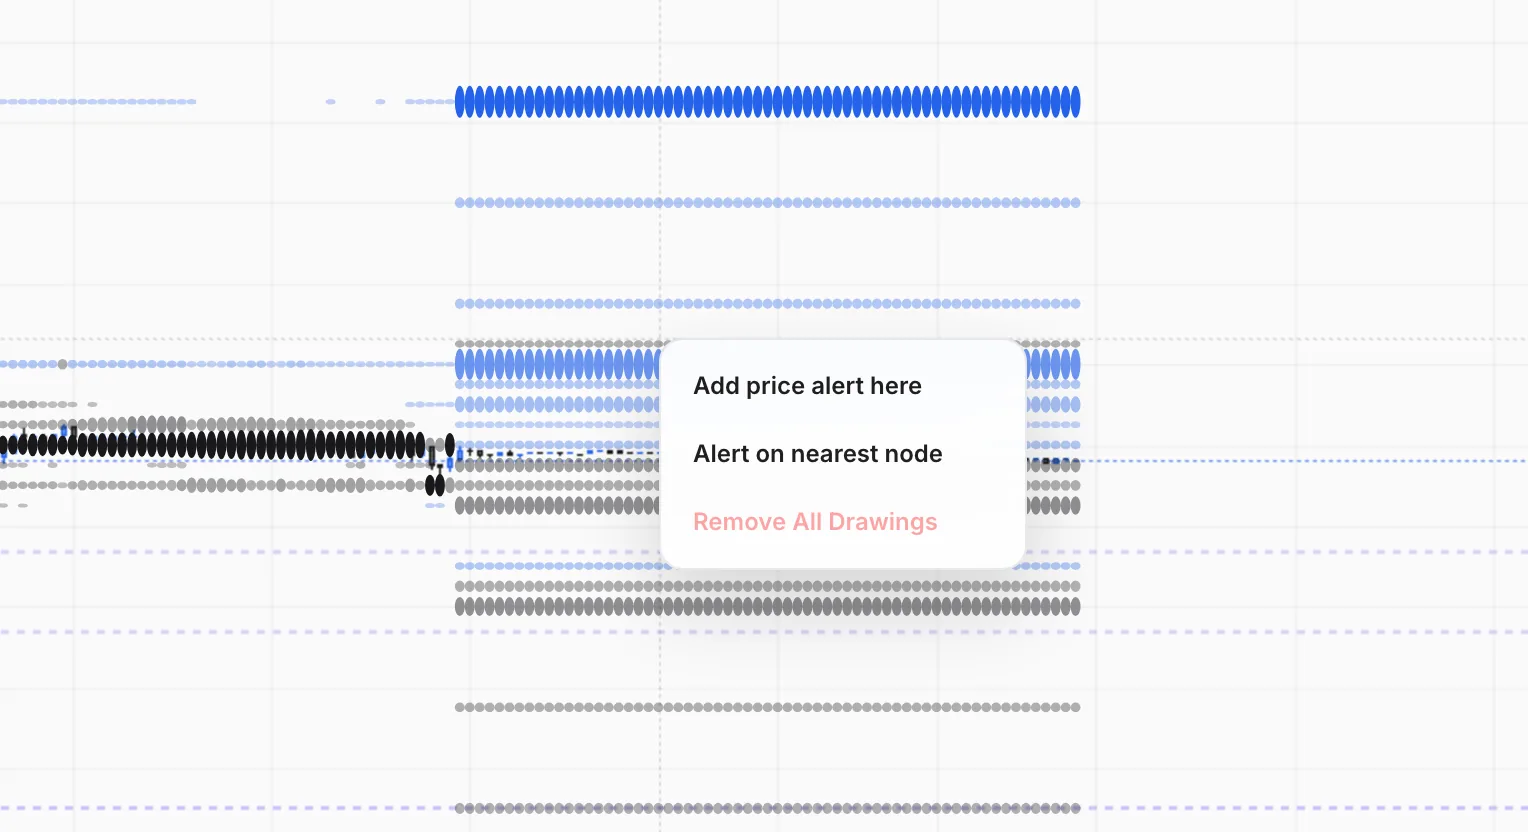
01 / 04Pick your symbol and horizon
Capabilities
What you can do with Atlas
Dealer positioning on the candles
Switch between GEX, VEX or both. Traders often use GEX for intraday support and resistance and VEX for multi-day bias. Projection draws positioning past the last candle, so you can plan around levels that are coming up.
Options flow and dark-pool levels
A Flow pane shows call and put premium per candle. Click a bar to see the trades behind it. Dark Pool draws the largest recent print levels as lines.
The heatmap beside the chart
Dock the Heatseeker heatmap for your symbol, or Trinity with up to 10 heatmaps side by side, without leaving the chart.
Futures levels from related products
Derived draws S&P levels on ES and Nasdaq levels on NQ, mapped onto the futures price. Gold, silver, Dow and Russell futures work the same way.
Layouts that follow you
Up to five panes with synced intervals and crosshairs. Layouts save as you work and follow your account to other devices.
Replay past sessions
Play a session back candle by candle, with the orbs and flow as they were at that minute. Start from a candle you pick, or drop in at random and practise calling the next level.
Every feature
Everything in Atlas
45 features · 5 groups
Symbol search
Chart stocks, ETFs, SPXW or futures such as ES1 and NQ1 by typing a ticker at the top left, and step through an open watchlist with the left and right arrow keys.
Guide: Symbol search (opens docs.skylit.ai in a new tab)Intervals
Match the candles to how you trade, from 1m to 1W or your own such as 7m or 90m, from the interval strip in the chart header.
Guide: Intervals (opens docs.skylit.ai in a new tab)Session, timezone and Candles
Choose RTH or ETH hours, your timezone and a candle style (Classic, Mono, Neon, Ocean or White) in Settings (Shift+S).
Guide: Session, timezone and Candles (opens docs.skylit.ai in a new tab)Fullscreen, Copy image and Save image
Give the chart the whole screen with Shift+F, or share a chart with the image buttons in each chart's own button row.
Guide: Fullscreen, Copy image and Save image (opens docs.skylit.ai in a new tab)Pane layout
Watch several symbols or timeframes at once in up to five panes, picked from Pane layout in the chart header.
Guide: Pane layout (opens docs.skylit.ai in a new tab)Sync
Decide whether settings, interval, crosshair, time window and price scale follow across panes from the Sync row in the Pane layout menu.
Guide: Sync (opens docs.skylit.ai in a new tab)Layouts
Come back to the same workspace every day on any device, since layouts save as you work and you cycle them with [ and ] or the layout switcher, or export and import them as a file.
Guide: Layouts (opens docs.skylit.ai in a new tab)Atlas on your phone
Open Atlas from the phone menu, under ATLAS or HEATSEEKER, with panes in stacked arrangements.
Guide: Atlas on your phone (opens docs.skylit.ai in a new tab)Keyboard shortcuts
Reach Settings, sidecars, Replay and drawing tools without the mouse, and press ? to see every shortcut.
Guide: Keyboard shortcuts (opens docs.skylit.ai in a new tab)
GEX, VEX and GEX+VEX
See where dealer hedging reacts to price, to volatility or both, from Settings > Exposure or with Shift+G, Shift+V and Shift+C.
Guide: GEX, VEX and GEX+VEX (opens docs.skylit.ai in a new tab)Expirations
Match the orbs to how long you hold, from Front for 0DTE to To OPEX or All for swings, in Settings > Exposure.
Guide: Expirations (opens docs.skylit.ai in a new tab)Nodes
Keep the chart clean by drawing a fixed count of strikes per candle, or only strikes above a share of the King Node with a P-value, in Settings > Exposure.
Guide: Nodes (opens docs.skylit.ai in a new tab)Node labels
Read each strong node's strike and size next to the orb, pinned left, right or just after the newest candle, from Settings > Exposure.
Guide: Node labels (opens docs.skylit.ai in a new tab)Derived
Draw S&P levels on ES, Nasdaq levels on NQ and levels for gold, silver, Dow and Russell futures, with the Derived button in the chart header or in Settings > Exposure.
Guide: Derived (opens docs.skylit.ai in a new tab)Distinct derived shapes and Derived at latest ratio
Tell derived orbs apart by their shape, or hold each derived strike on one line, from the Exposure cog.
Guide: Distinct derived shapes and Derived at latest ratio (opens docs.skylit.ai in a new tab)Color and Match heatmap palette
Pick Default, Warm, Cool or Mono orbs, or color them exactly like the heatmap cells, in Settings > Exposure.
Guide: Color and Match heatmap palette (opens docs.skylit.ai in a new tab)Orb size and King Opacity
Set how big and bright orbs get so the King Node stands out, in Settings > Exposure.
Guide: Orb size and King Opacity (opens docs.skylit.ai in a new tab)Realtime values
Keep orb sizes and labels current from the live stream between regular updates on the Front expiration, in Settings > Exposure.
Guide: Realtime values (opens docs.skylit.ai in a new tab)Scroll as replay
Study past orbs as they looked at the time when you scroll back, on by default in Settings > Exposure.
Guide: Scroll as replay (opens docs.skylit.ai in a new tab)Projection
Plan around levels that are coming up by drawing positioning past the last candle, from Settings > Projection.
Guide: Projection (opens docs.skylit.ai in a new tab)
Flow
See call and put premium for each candle, with filters such as Trade Type, Moneyness and DTE, from Settings > Add.
Guide: Flow (opens docs.skylit.ai in a new tab)Flow Bucket
Check the trades behind a burst of flow, with net flow, put/call and top contracts, by clicking a bar in the Flow pane.
Guide: Flow Bucket (opens docs.skylit.ai in a new tab)Dark Pool
See whether a node lines up with the largest recent dark-pool print levels, drawn as lines from Settings > Add.
Guide: Dark Pool (opens docs.skylit.ai in a new tab)VWAP
Anchor volume-weighted average price to the session, week, month, quarter, year or a stock's earnings date, with up to three bands, from Settings > Add.
Guide: VWAP (opens docs.skylit.ai in a new tab)GEX VWAP and VEX VWAP
See where the option board's exposure is centred as a line with an optional band, from Settings > Add.
Guide: GEX VWAP and VEX VWAP (opens docs.skylit.ai in a new tab)Flow VWAP and Net Premium
Follow which side options money is building on through the session, from Settings > Add.
Guide: Flow VWAP and Net Premium (opens docs.skylit.ai in a new tab)Volume, CVD, Candle Delta and Footprint
See traded volume split by side from the tape, including the running total in CVD, from Settings > Add.
Guide: Volume, CVD, Candle Delta and Footprint (opens docs.skylit.ai in a new tab)Volume Profile and TPO
Find the busiest prices of the session with Point of Control and Value Area, from Settings > Add.
Guide: Volume Profile and TPO (opens docs.skylit.ai in a new tab)Session Levels and Session Zones
Mark prior-day, premarket, Asia, London, initial-balance, week and month highs, lows and opens, and shade each part of the session, from Settings > Add.
Guide: Session Levels and Session Zones (opens docs.skylit.ai in a new tab)EMA, SMA and Bollinger
Add the usual moving averages and bands next to the orbs, from Settings > Add.
Guide: EMA, SMA and Bollinger (opens docs.skylit.ai in a new tab)
Heatmap sidecar
Keep the full Heatseeker heatmap for your symbol docked beside the chart, synced to the focused pane, with Shift+H or in Settings.
Guide: Heatmap sidecar (opens docs.skylit.ai in a new tab)Trinity sidecar
Watch up to 10 heatmaps side by side, and use the Spot pill to read SPY strikes as ES prices on an ES chart, with Shift+T or in Settings.
Guide: Trinity sidecar (opens docs.skylit.ai in a new tab)Watchlist sidecar
Keep your lists, live quotes and a Favorites section in view, with columns you choose, from Settings.
Guide: Watchlist sidecar (opens docs.skylit.ai in a new tab)Trade Deck
See your Nexus paper positions where price is and paper trade them in one tap, from the Trade Deck row in Settings.
Guide: Trade Deck (opens docs.skylit.ai in a new tab)Traders
See positions of traders you follow on Nexus on the symbol you are charting, from the Traders row in Settings.
Guide: Traders (opens docs.skylit.ai in a new tab)Ask Talon
Get a plain-language read of the chart you are looking at, since Talon knows your symbol, interval, panes, exposure view and open sidecars and can scan your Atlas watchlists.
Guide: Ask Talon (opens docs.skylit.ai in a new tab)Price data by API
Pull Atlas price data into your own tools, paid with Skylit API credits, from docs.skylit.ai > Atlas > API Reference.
Guide: Price data by API (opens docs.skylit.ai in a new tab)
Price alerts
Get told when price reaches a level instead of watching the screen, by right-clicking the chart and picking Add price alert here, with a Once or Repeat trigger.
Guide: Price alerts (opens docs.skylit.ai in a new tab)Alert on nearest node
Alert on a node that holds its price or follows the node to another strike, from the chart's right-click menu or a node in the Heatmap or Trinity sidecar.
Guide: Alert on nearest node (opens docs.skylit.ai in a new tab)Alert Lines
Draw this symbol's alerts as lines you can drag to a new price, by turning on Alert Lines in Settings.
Guide: Alert Lines (opens docs.skylit.ai in a new tab)Alerts sidecar
Manage every price alert across symbols, switch one on or off, and jump to its symbol, with Shift+A.
Guide: Alerts sidecar (opens docs.skylit.ai in a new tab)Drawing tools
Mark your own trendlines, levels, rectangles, Fibonacci and long or short position plans from the drawing rail behind the pencil icon, or with Alt shortcuts.
Guide: Drawing tools (opens docs.skylit.ai in a new tab)Magnet
Snap drawings to a candle's open, high, low or close with Alt+M.
Guide: Magnet (opens docs.skylit.ai in a new tab)Drawing presets
Save a Fibonacci or line style under a name and star it as the default, with up to 50 presets that follow your account.
Guide: Drawing presets (opens docs.skylit.ai in a new tab)Replay
Review a past session candle by candle with the orbs and flow as they were, or press Random to practise reading an unknown minute, with Replay in the chart header or Shift+R.
Guide: Replay (opens docs.skylit.ai in a new tab)
Why traders pay for it
What Atlas puts in your hands
What's uniquely in hand
Dealer positioning, options flow and dark-pool levels drawn on the candles, bar by bar, so you see when several reasons stack at one price.
Time it gives back
No marking levels by hand and no flipping tabs: the heatmap docks beside the chart, alerts sit on the nodes, and your layouts follow you to every device.
What it replaces
A standalone charting package, plus the exposure and flow tools you would otherwise keep open beside it.
Included with Pro.Market data licensed via NASDAQ, CBOE and OPRA.
Pairs with
Atlas with the rest of Skylit
Heatseeker
The source of the orbs. Use the full heatmap for the whole board and velocity, and Atlas to see how price behaves at those strikes.
Flowseeker
The source of the Flow pane and Dark Pool levels. Find a print in Flowseeker, then check on Atlas whether it landed at a node.
Nexus
Trade Deck puts your Nexus paper positions on the chart. Traders shows positions of traders you follow on the same symbol.
Talon
Ask about the chart you're looking at. Talon knows your symbol, interval, exposure view and open sidecars, and reads them in plain language.
Leaving Atlas from the menu(in the guide, opens docs.skylit.ai in a new tab)
Picking another page in the menu while on Atlas, such as Heatmaps, now opens it on the first click, with no flicker back.
Atlas in the Heatseeker menu(in the guide, opens docs.skylit.ai in a new tab)
Atlas now also appears under HEATSEEKER, on desktop and phone, so you can jump between the heatmap and the chart in one tap.
Talon canvas uses your chart settings(in the guide, opens docs.skylit.ai in a new tab)
The Talon canvas chart now opens with your Atlas colors, candles, Dark Pool settings and interval, so it looks like the chart you know.
Which plan includes Atlas?
Atlas comes with the Pro plan.
Do I need a separate charting account?
No. Atlas is Skylit's own chart, inside the Skylit app.
Does Atlas tell me which way the market will go?
No. An orb shows how price tends to move through a level (slowed down or sped up), not which way it will go. Atlas shows positioning, flow and price together. The thesis is yours.
When do I use GEX vs VEX?
GEX tracks how dealer hedging reacts to price, which is why traders read it for intraday support and resistance. VEX tracks how it reacts to volatility, which traders lean on for multi-day bias. GEX+VEX shows both. These are rules of thumb, not tested signals.
Can I chart ES and NQ futures?
Yes. Chart continuous contracts such as ES1 and NQ1, and turn on Derived to draw levels from the related S&P or Nasdaq options on the futures price. Derived levels drift slightly during the day as the two prices move apart.
Why do my orbs look different from the heatmap?
They use the same positioning data in different views. When they disagree, the two are almost always set to different expirations. Set Expirations to Front to compare like for like.
See where the levels line up.
Atlas is included with Pro. Educational tool, not financial advice.