 Atlas
EMA
The exponential moving average of the close, weighted toward recent bars, with an optional bar offset.
The EMA is a moving average that gives recent bars more weight than older ones. Because of that it turns sooner than an SMA of the same length. When NQ rips off a morning low, a 9 EMA starts curling up a few bars before the 9 SMA does. The price you pay for that speed is more whipsaw when the market chops sideways.
Reach for it when you care about the current swing: where the short-term trend is and whether price is holding above it or slipping under it.
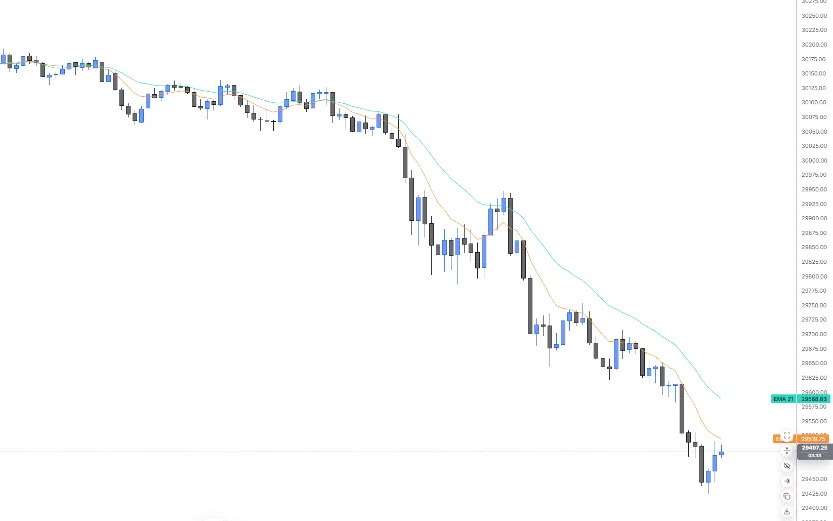
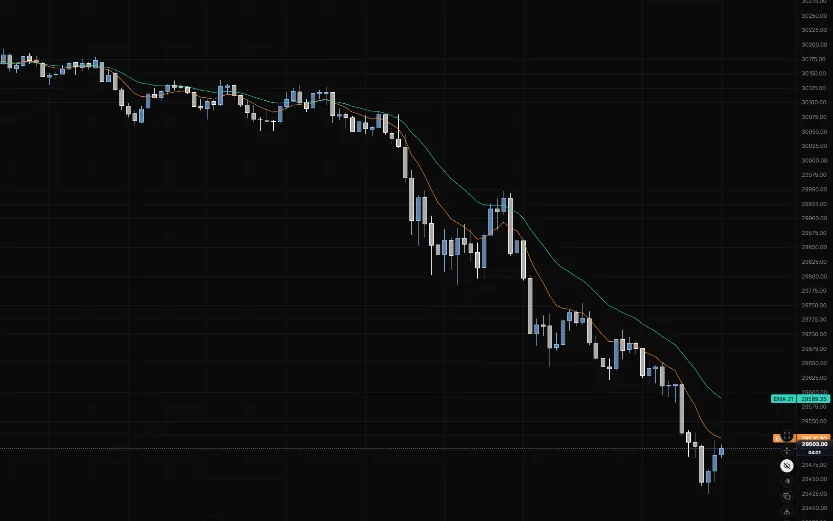
NQ 5m, Oct 16, 2026 · Atlas
Adding the indicator
Open the chart settings panel and use the Add button in the Indicators section. EMA sits in the Overlay group at the top of the menu, beside SMA and HMA. Each instance gets its own settings cog and can be removed the same way, so you can run a 9 and a 21 side by side, each in its own colour.
Settings
| Setting | Options | What it controls |
|---|---|---|
| Period | 9 (default), any whole number from 1 to 5,000 | How many bars the average looks back over. |
| Offset | 0 (default), -500 to 500 bars | Shifts the drawn line sideways. Positive moves it right (into the future), negative moves it left. The math doesn't change, only where the line is drawn. |
| Colour | Any colour | Picked from the palette when you add it, changeable any time. |
| Width | 1 (default), 2, 3, 4 | Line thickness. |
| Style | Solid (default), Dashed, Dotted | Line pattern. |
| Opacity | 10% to 100% (default) | How strong the line draws. |
| Label | Always (default), On hover, Off | The price-axis badge and the name on the chart. On hover shows them only while the crosshair is close to the line. The crosshair readout keeps showing the value either way. |
Reading notes
- It's built from the close. Each bar contributes its closing price, so the forming bar's value moves with every tick until that bar closes.
- Warm-up is standard. The first value appears once a full period of closes exists, seeded from a simple average of those closes. Before that, nothing is drawn.
- The row label tells you the setup. An instance reads "EMA 21", and an offset one reads "EMA 21 · +5", so two EMAs on the same chart are easy to tell apart in the list.
Last updated