 Atlas
Footprint
Sell and buy volume at every price row inside each candle, with each candle's busiest row outlined as its POC.
Footprint opens each candle up and shows where inside the bar the volume traded, and which side it hit. Every candle becomes a small ladder of price rows, with sell volume on one side and buy volume on the other. The heaviest row is outlined as that candle's POC (point of control).
It's the closest look you get at a single bar. On an ES 5-minute candle that wicked into a level, you can see whether the size at the top was buyers getting filled or sellers leaning on it, and which rows the volume stacked on.
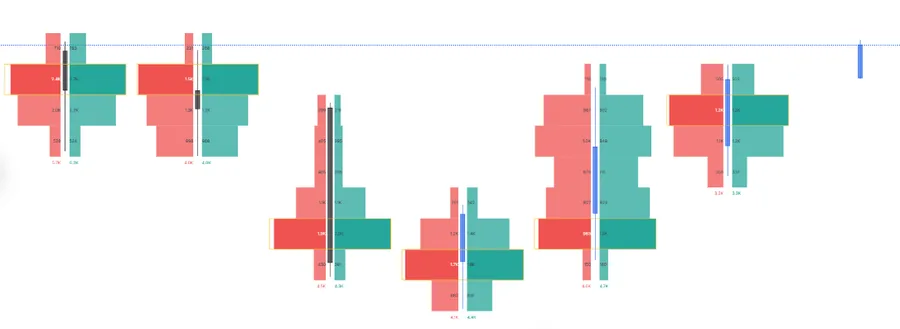
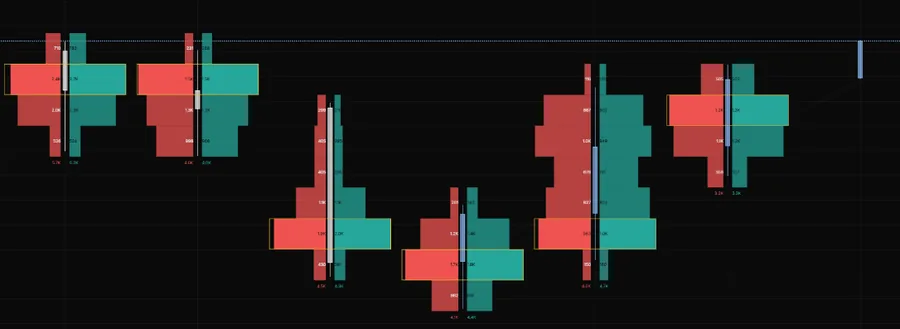
NQ 5m, Oct 16, 2026 · Atlas
Adding the indicator
Open the chart settings panel and use the Add button in the Indicators section. Footprint sits in the Overlay group next to Candle Delta. One instance per chart pane.
Settings
| Setting | Options | What it controls |
|---|---|---|
| Row size | Auto (default), Ticks | Auto picks a row height from the candles on screen and keeps it while you stay on that symbol and interval. Ticks lets you set it. |
| Ticks | 4 (default) | How many of the instrument's own ticks each price row spans. Used when Row size is Ticks. |
| Buy / Sell | Two colours | Teal for buy and red for sell by default. |
| Numbers | On (default), Off | Prints each row's sell and buy volume, plus the candle's totals under the bar. |
| POC | On (default), Off, plus a colour | Outlines each candle's heaviest row. Amber by default. |
Reading notes
- It works from 2 minutes up to intraday intervals. A 1-minute chart has nothing to split (one minute is one sub-bar), and daily or wider isn't offered because one trading session spans two calendar days. Tick and second charts aren't supported either.
- Read a row's lean, not its last digit. Each candle is built from one-minute pieces, and volume inside a minute is spread evenly across that minute's range. That places it within a fraction of a point, which is plenty for seeing where size stacked but not for exact per-tick counts.
- Rows line up across candles. They sit on a fixed tick grid, so the same price is the same row from one bar to the next.
- Zoom in for detail. Cells show first, numbers appear once each row is tall enough to fit them (about 12 px). If they don't show, widen the candles or raise the row size.
- It needs the symbol's own volume. On stocks and ETFs that's a sample of the full tape, so read sizes as relative. SPXW and VIX have no traded volume of their own, so Footprint shows nothing there rather than borrowing another symbol's prices.
Last updated