 Atlas
Initial Balance
The high and low of the first 15, 30 or 60 minutes of the New York, London and Asia sessions, with a 50% line, retracement levels and an optional extension ladder.
The Initial Balance (IB) is the high and low of the first stretch of a session, 30 minutes by default. Atlas draws one for New York (09:30 ET), London (08:00 London time) and Asia (09:00 Tokyo time), each with its high, its low, a 50% line and retracement lines inside the range. An optional ladder steps out above and below the range in multiples of its size.
Plenty of traders frame the whole day off the opening range: whether NQ accepts above the IB high, fails back inside, or rotates to the 50%. Labels on the chart read like IB30 NY High, so you always know which session and length a line belongs to.
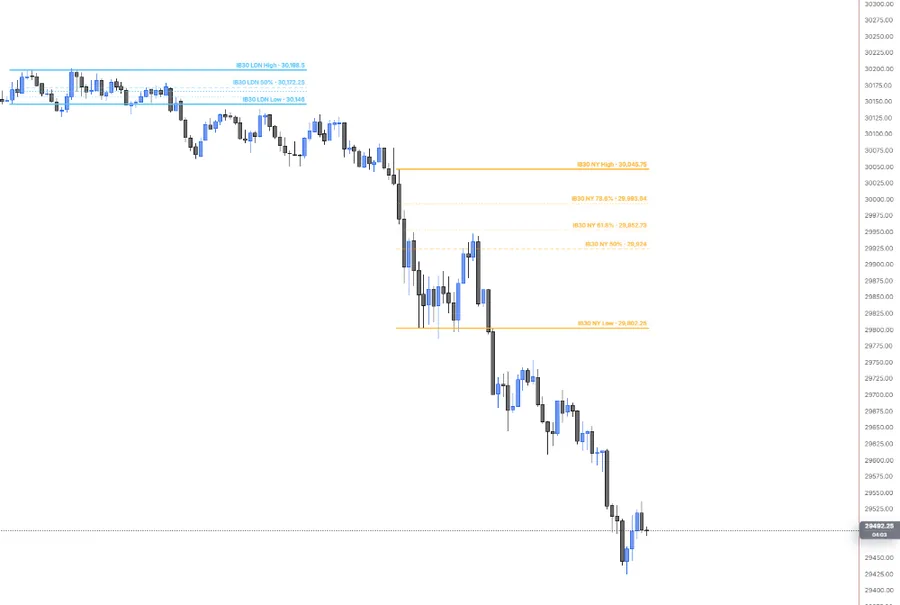
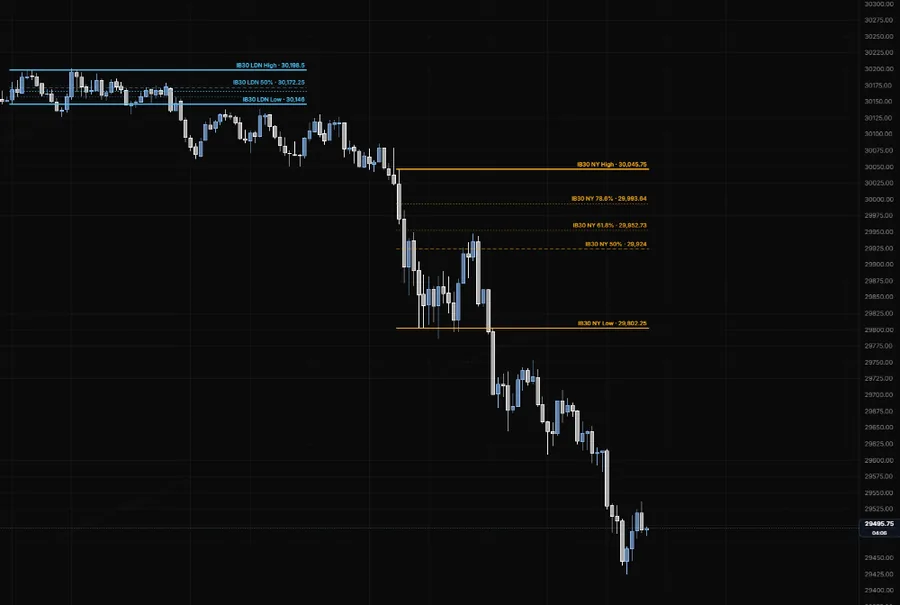
NQ 5m, Oct 16, 2026 · Atlas
Adding the indicator
Open the chart settings panel and use the Add button in the Indicators section. Initial Balance sits in the Overlay group next to Killzones. One instance per chart pane. Typing ib, fib or golden zone into the Add menu's filter box finds it.
Settings
| Setting | Options | What it controls |
|---|---|---|
| IB length | 15, 30 (default), 60 minutes, or Custom (1 to 180) | How many minutes after the open make up the range. Your chart bars have to be that length or shorter. |
| Sessions | New York, London, Asia, each on by default, with its own colour | Which sessions draw an IB. |
| 50% line | On (default), Off, with Dashed (default), Solid or Dotted | The line halfway between the IB high and low. |
| Retracements | 38.2%, 61.8% (on by default), 78.6% | Retracement lines inside the range. |
| Fib direction | Auto (default), Bullish, Bearish | Auto sets the direction once, when the IB window closes. Bullish measures down from the high, so the levels read as pullbacks to buy. Bearish measures up from the low, so they read as bounces to sell. |
| Your own retracements | Up to 8 levels, in percent | Add levels like 23.6 or 88.6. They measure the same way as the built-in ones. |
| Extension ladder | Off (default), On | Fainter lines stepping out past the high and the low, up to 10 on each side. |
| Ladder spacing | Even steps (default), Your own multiples | Even steps puts a line every step. Your own multiples puts lines only where you list them (default 0.5, 1, 1.5, 2, 3 IB ranges). |
| Ladder step and depth | Step 0.1 (default), 0.25, 0.5. Depth 0.1 to 2, 0.5 by default | The gap between lines and how far the ladder reaches, both in IB ranges. |
| Ladder side | Both (default), Above the high, Below the low | Which side the ladder draws on. |
| Ladder colour and line | Session colours (default) or One colour. Dotted (default), Dashed, Solid | How the ladder looks. |
| Show ladder on | Current session (default), All sessions | Ladder on the newest range only, or on every session you have on. |
| Range box | Off (default), On, box fill 0.02 to 0.3 (0.06 default) | Shades the IB window itself, from first bar to last, between the high and the low. |
| Extend lines | Off (default), On | Runs each session's newest range out to the chart's right edge instead of stopping at the session close. |
| Labels | On (default), Off. Position Left, Center, Right (default). Prices on (default) | Tags on each line. A tag that would land on top of another is left out. |
| Range readout | Off (default), On, with a tick size (Auto reads it off the bars) | A tag on the newest range with its size, like IB30 NY · 15.25 pts · 61 ticks. |
| Keep older sessions | Off (default), On | Keeps up to 3 earlier ranges per session, faded. |
| Opacity | 0.2 to 1 (default) | How strong the lines are. |
Reading notes
- You never trade off a half-built range. A new IB only shows once its window has closed. Until then, each session shows its last finished range.
- The direction is locked at the close of the IB window. On Auto, a close in the lower half measures up from the low and a close in the upper half measures down from the high. After that the lines don't move.
- Lines stay inside their session. New York runs to 16:00 ET, London to 08:00 ET and Asia to 15:00 Tokyo time, unless you turn on Extend lines.
- Stocks and index feeds only show New York. They have no bars at the London or Asia open. Open a futures chart for all three.
- It's built from the bars on your chart, so it works the same in replay. It doesn't draw on tick charts, where bars have no fixed length.
Last updated