 Atlas
MACD
Momentum in its own pane: the MACD line, a slower signal line, and a four-shade histogram of the gap between them.
MACD tracks momentum as the gap between a fast and a slow moving average. The MACD line is the fast average minus the slow one. The signal line is a slower average of the MACD line. The histogram is the distance between the two, so you can see momentum building or fading before the lines actually cross.
The lines crossing and the histogram flipping sides of zero are the classic momentum shifts. On an ES 15-minute chart, a histogram shrinking for several bars while price still makes new highs says the push is losing steam, even before anything crosses.
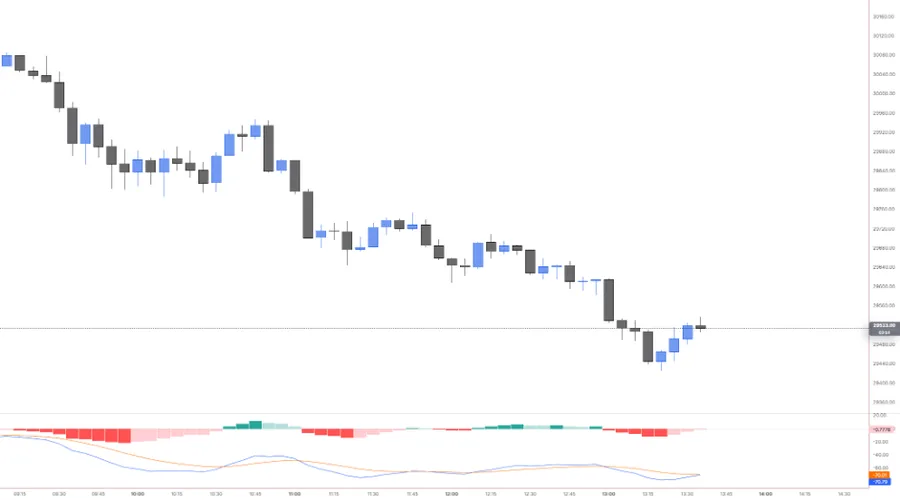
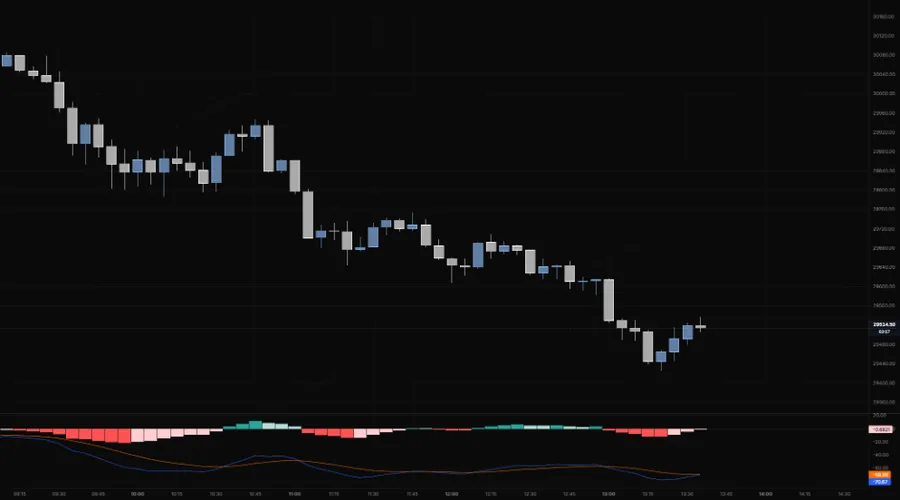
NQ 5m, Oct 16, 2026 · Atlas
Adding the indicator
Open the chart settings panel and use the Add button in the Indicators section. MACD sits in the Subpane group. You can add up to four, each in its own pane.
Settings
| Setting | Options | What it controls |
|---|---|---|
| Fast length | 12 (default) | The fast average. |
| Slow length | 26 (default) | The slow average. |
| Source | Close (default), Open, High, Low, HL2, HLC3, OHLC4 | The price each bar feeds in. |
| Signal smoothing | 9 (default) | The length of the signal line's average. |
| Oscillator MA type | EMA (default), SMA | How the fast and slow averages are computed. |
| Signal MA type | EMA (default), SMA | How the signal line is computed. |
| MACD line | On (default), plus a colour | Blue by default. |
| Signal line | On (default), plus a colour | Orange by default. |
| Histogram | On (default) | The bars between the two lines. |
| Above zero | Rising, Falling colours | Dark green while the histogram grows above zero, light green while it shrinks. |
| Below zero | Rising, Falling colours | Light red while it rises back toward zero, dark red while it falls. |
Reading notes
- The four shades do the reading for you. Light green means positive momentum is fading. Light red means negative momentum is fading.
- The forming bar updates live. In replay, only bars up to the cursor are used.
- MACD has no fixed scale. Its values are in price units, so a reading on NQ isn't comparable to one on SPY. Compare it against its own history on the same chart.
Last updated