 Atlas
Bollinger Bands
A moving-average basis with an upper and lower band set a chosen number of standard deviations away, so the envelope itself reads volatility.
Bollinger Bands draw a moving average with a band above and below it, each set a number of standard deviations of price away. When the market gets quiet the bands pinch together. When it starts moving they spread apart. So the envelope is a volatility read on its own: a tight squeeze on QQQ after a slow lunch often comes before the afternoon move, though it won't tell you which way.
A tag of the upper or lower band means price is stretched relative to its recent range. In a range that's often where moves stall. In a strong trend, price can walk along one band for a long time.
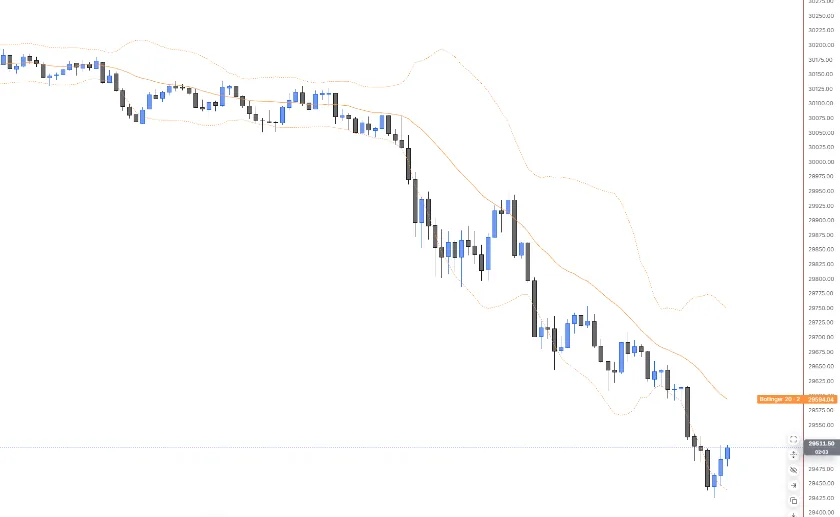
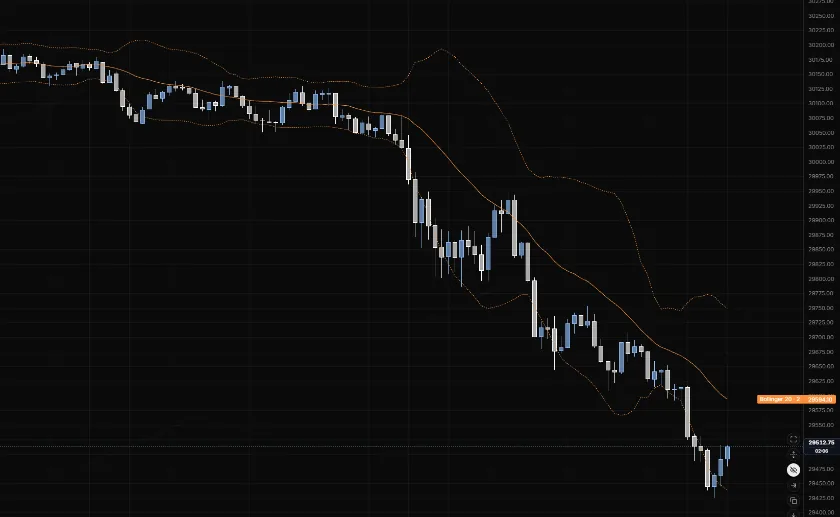
NQ 5m, Oct 16, 2026 · Atlas
Adding the indicator
Open the chart settings panel and use the Add button in the Indicators section. It's listed as Bollinger in the Overlay group. Each instance gets its own settings cog and can be removed the same way.
Settings
| Setting | Options | What it controls |
|---|---|---|
| Period | 20 (default), any whole number from 1 to 5,000 | The window for both the basis average and the standard deviation. |
| Std dev | 2 (default), above 0 up to 10 | How many standard deviations out the bands sit. Higher means a wider envelope and rarer tags. |
| Basis line | Colour, width (1 to 4), style, opacity | The middle line. Solid by default. |
| Upper and lower lines | Colour, width (1 to 4), style, opacity | Each band styled on its own. Dashed by default. |
| Label | Always (default), On hover, Off | The price-axis badges and the name on the chart. The crosshair readout keeps showing all three values either way. |
Reading notes
- All three lines share one window. The basis is a simple average of the last N closes, and the bands are measured from the spread of those same closes.
- It's built from the close, so the forming bar's bands move until that bar closes.
- The row label shows both numbers. An instance reads "Bollinger 20 · 2", so a 20 · 2 and a 20 · 3 on the same chart are easy to tell apart.
- Want the candles flagged for you? The RSI × Bollinger Combo colours the candles that close outside the bands while RSI agrees.
Last updated