 Heatseeker
Core Concepts
The ideas behind reading a Heatseeker map: nodes, King and Gatekeeper nodes, midpoints, retests, rate of change and more.
Nodes
Heatseeker™ is built to reveal dealer exposure at each strike price and expiration.
Each strike displays a value (positive or negative), and each value is represented by a color:
| Exposure Type | Color Range | Typical Behavior |
|---|---|---|
| Positive Exposure | Green → Yellow | Lower-volatility interaction |
| Negative Exposure | Blue → Purple | Higher-volatility, “wicky” movement |
Key Principle
The most important factor is not whether a node is positive or negative — nor its color.
What truly matters is the absolute value of the node.
The larger the absolute value, the stronger the pull it exerts on price.
How Price Interacts with Each Node
- Positive Node → Lower-volatility interaction; price tends to move smoothly, with fewer wicks or spikes.
- Negative Node → Higher-volatility interaction; price becomes wicky and more violent.
When price interacts with a negative gamma node, it can overshoot before reversing, which can catch traders on the wrong side of the move.
Concept of Magnets
Every node on the Heatseeker map acts like a magnet in the market.
Price is attracted to these zones due to dealer positioning — yet these same areas can also act as walls that repel price and create reversals.
Magnetic Behavior
- As price moves farther away from a high-value node → the magnetic pull weakens.
- As price approaches a high-value node → the magnetic pull strengthens.
- When price directly interacts with a node, a deflection or repulsion may occur — similar to when two positive ends of a magnet meet and push apart.

Think of nodes as dynamic magnets — their influence grows as price converges and fades as it diverges.
King Nodes
King Nodes are the highest absolute value nodes on the heatmap.
They represent where Market Makers (MMs) hold the greatest exposure — and where price often gravitates near expiration.

Key Characteristics
- There can be multiple significant nodes with large values.
- When multiple strong nodes exist, they can pull in opposite directions, creating range-bound pinning or whipsaw movement.
Price Behavior Around King Nodes
-
Pin Jobs (Common near End of Day)
MMs often pin price near the King Node late in the session.- Tight ranges form.
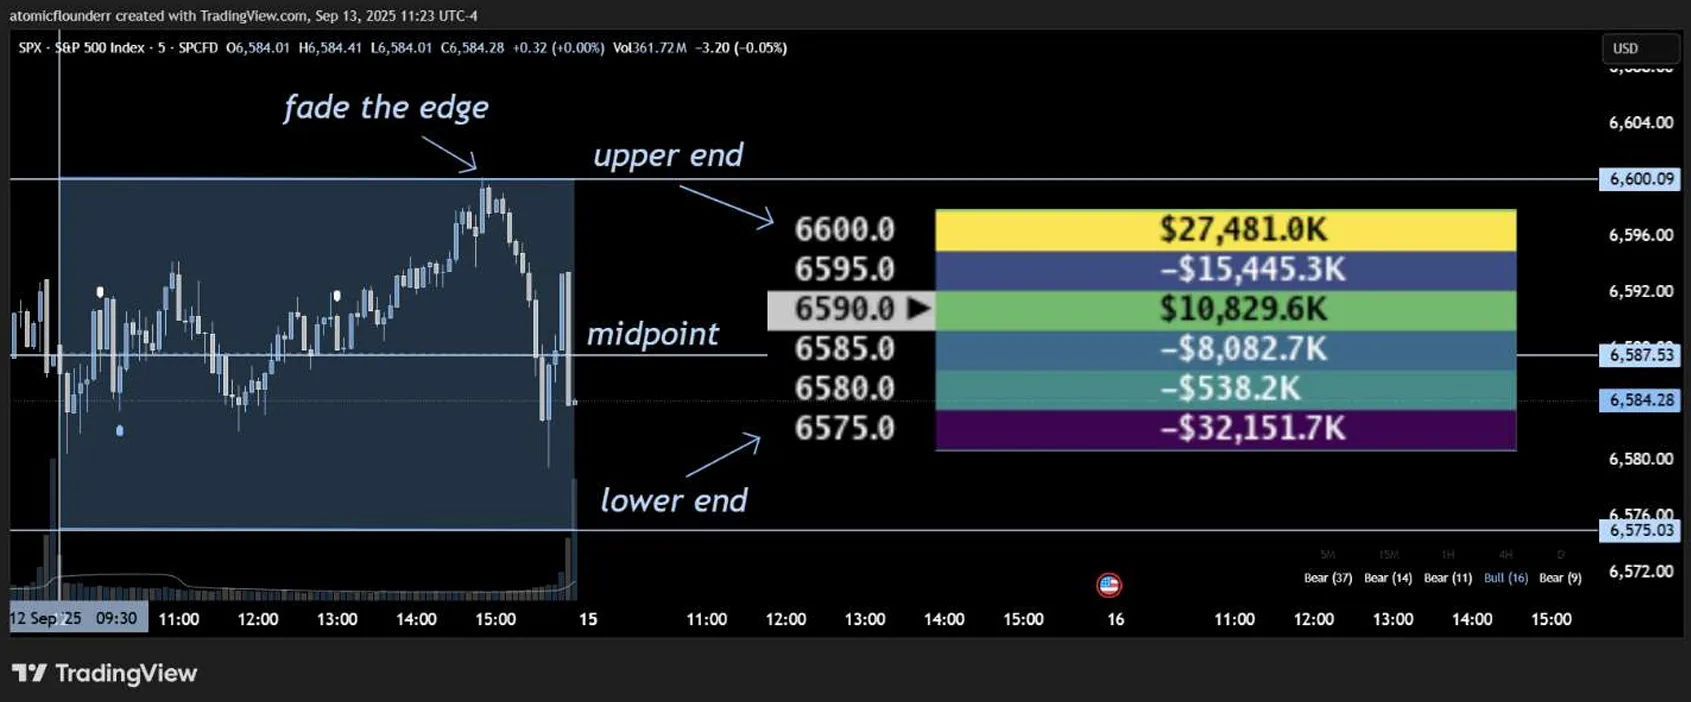
- Traders often watch the edges of the range.

-
Drives Away (Common early in the day)
When price reaches the King Node too early, MMs may push it away.
Holding price there all session would require constant defense, so they often trigger an early drive-off.
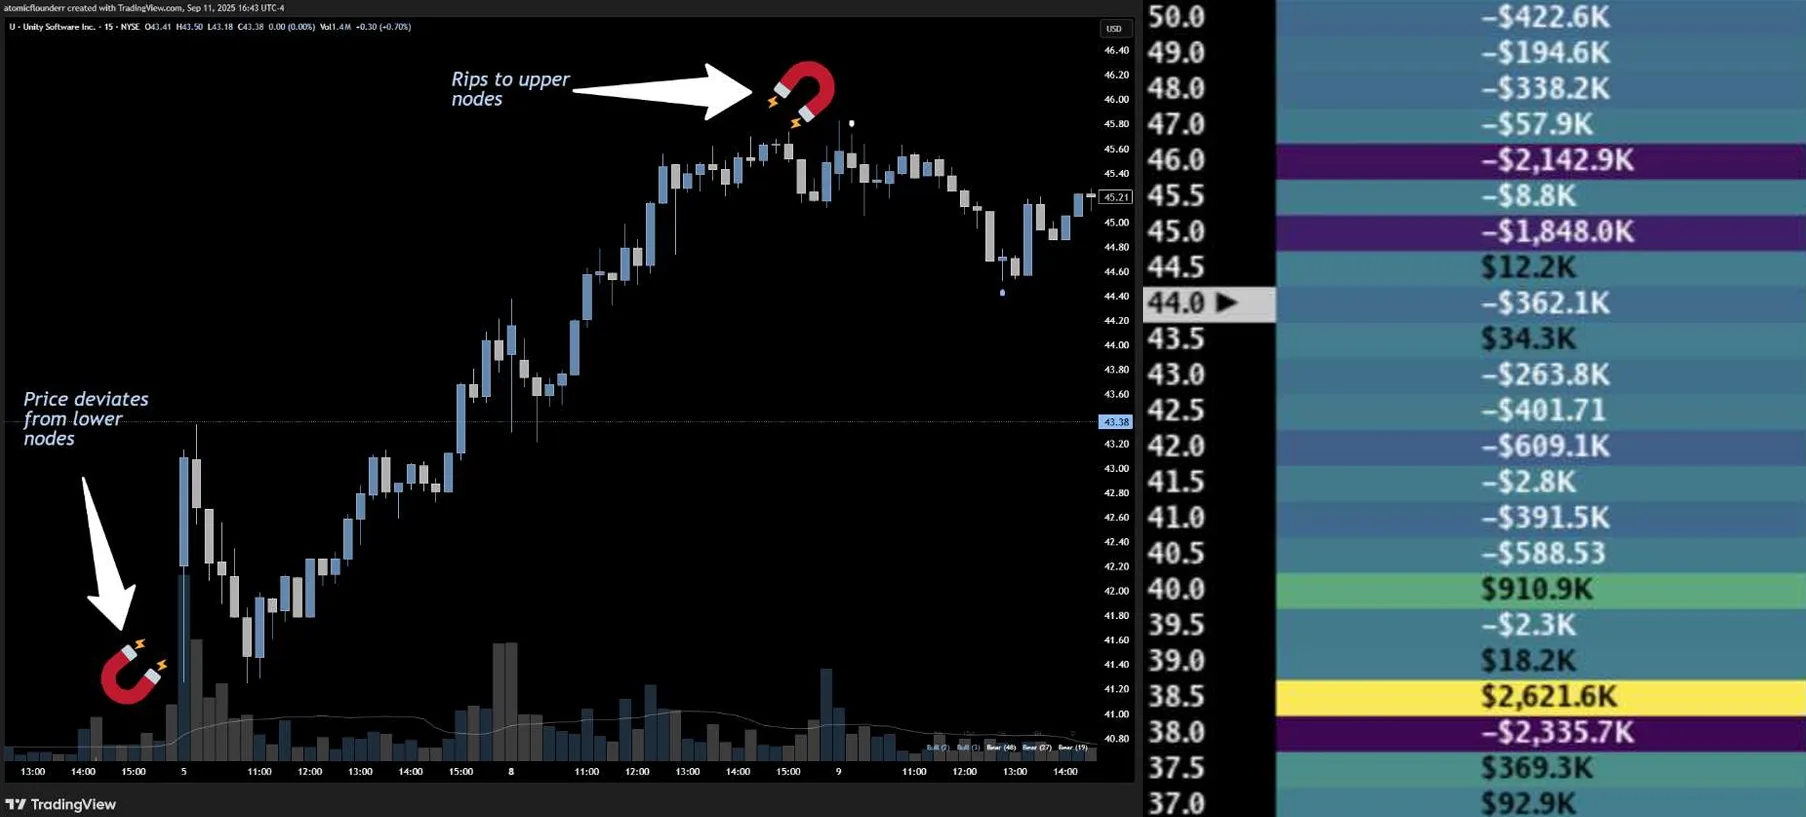
Margin of Interaction
King Nodes don’t always reject to the exact cent.
Expect a deflection margin of roughly 5–10 points on SPX.
Note: In the example above, the rejection came about 5½ points from the King Node and still counts as a reaction to it.
Gatekeeper Nodes
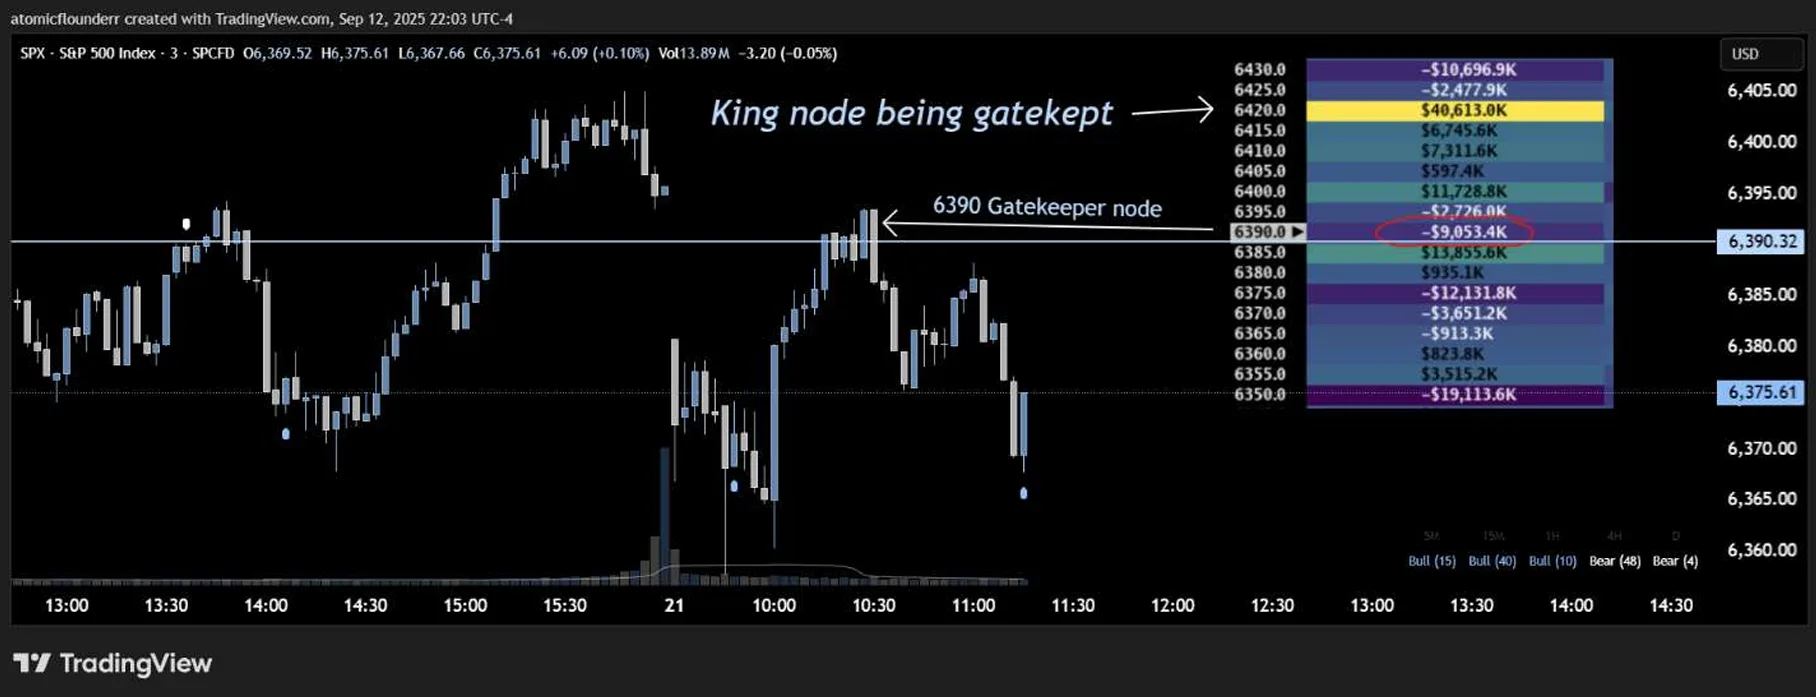
Gatekeeper Nodes act like bouncers at the door of a nightclub — they prevent price from easily reaching the King Node.
These nodes function as deflection points that can cause major directional shifts.

Behavior
- If price tests and fails at a Gatekeeper Node → the map can reshuffle.
- Reshuffles often precede a trend change or realignment of where dealers aim to pin price.
- Gatekeeper rejections near the start of the day are a common place traders watch for reversals.
After a rejection, the map often reshuffles, and the new layout shows where positioning is leaning next.
Midpoints
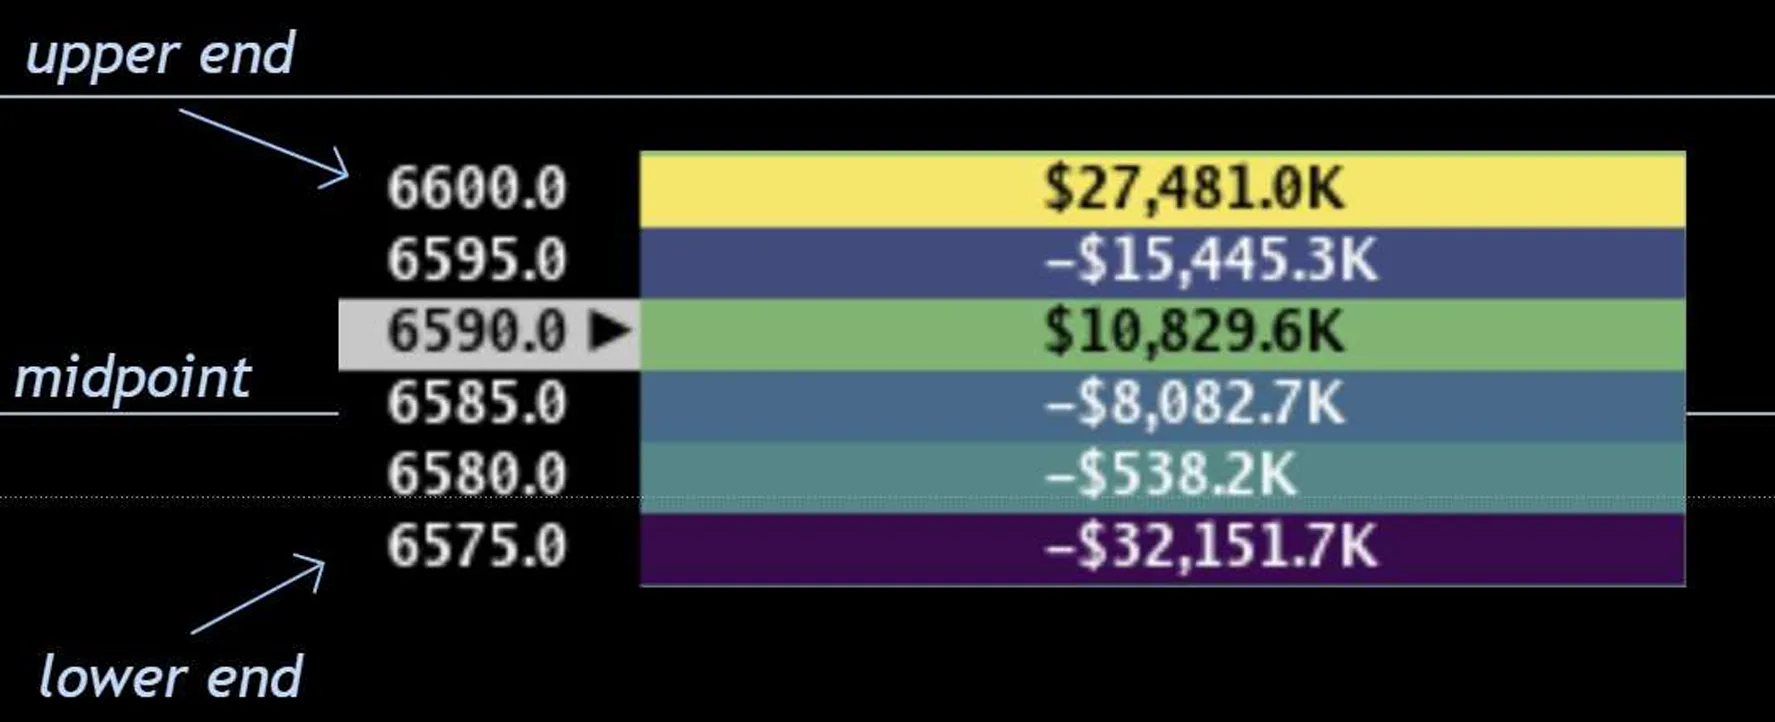
Midpoints sit between the edges of a range. Direction there is the least clear, which makes them a poor spot for directional risk-to-reward.
- Option and spread sellers read midpoints differently from directional traders.
Why Midpoints Are Dangerous
- Dealers are often comfortable in range-bound conditions.
- The upper and lower ranges are easily visible on the heatmap.
- When price is in the middle of the range, direction becomes uncertain.
From the middle of a range, the distance to either edge is similar, so the risk-to-reward is roughly 1:1 rather than asymmetric.
What many traders watch instead: price approaching the edge of the range, where the risk is easier to define.
Price Delivery & Node Retests
When looking for bounce plays off a node, context matters — not all nodes retain influence forever.
Node Retest Strength
| Touch | Typical reaction | Notes |
|---|---|---|
| First Touch | Strongest | Fresh level; dealers tend to defend it hardest |
| Second Touch | Weaker | Often forms double tops/bottoms |
| Third+ Touches | Weakest | The level is less likely to hold |
If price has already been delivered from a node (touched and moved away), its influence weakens.
Each additional test reduces the likelihood of a strong bounce.
- Caption: ACN 240 node test, targeting upside nodes, from September 10th, 2025.
Key Takeaway:
Untouched nodes tend to react more strongly than ones that have already been tested.
Price Delivery From a Node
When price bounces off a Gatekeeper node or King node, we don't always get reversion back to that specific node!
- A node that has been interacted with tends to have less influence over price action, because the node is no longer "fresh".
- A return to that node becomes less likely.

Key note: a node that has already been interacted with tends to matter less than a fresh one, which is why many traders focus on the freshest levels.
Price Delivery and Node Size
-
If price gets a rejection (in a bearish scenario) or a bounce (in a bullish scenario) off a node, a few things may occur:
-
Gradual decrease of the node we were delivered from - in this case, the likelihood of a return back to the node in question becomes low probability.
PEP Price Delivery Case Study From October 15th, 2025 at 09:30am EST

- Increase of the node we were delivered from - higher likelihood of a reversion back to the node in question.
By keeping an eye on key nodes for rate of change, we can make inferences as to whether a reversion back to a deflection node is likely. Looking for increase in size of node gives us higher likelihood for price to return, whereas a decrease in node size gives us lower likelihood for reversion.
-
Power Hour Liquidations
In the last half hour before the close, some brokers auto-liquidate accounts that fail margin requirements.
That can create forced order flow in highly liquid names like SPX, SPY and QQQ.

Why It Matters
- Can trigger volatility spikes right before the close.
- Can force breakouts or fakeouts near Gatekeeper Nodes.
- Near a King Node, can accelerate the move.
- Sometimes reshuffles the entire map.
Power Hour moves are often mechanical (forced selling) rather than a change in view.
Rate of Change of a Node
Heatseeker™ not only shows dealer positioning, but also how fast liquidity changes.
Reading Node Momentum
- Rapid Accumulation → Dealers are quickly adding exposure; acts like a magnet that pulls price in strongly.
- Rapid Unwinding → Exposure vanishes; levels that looked strong may suddenly weaken.
- Fast changes often cause volatility spikes, explosive moves, or sharp reversals.

Watch the rate of change — it reveals urgency and intent behind Market Maker adjustments.
Rolling of Ceilings / Floors
Another key concept in relation to node rate of change is the behavior in how rate of change occurs:
- Rolling of ceilings - Considered strong presumptive evidence of a bearish thesis playing out.
- Occurs when we see the upside ceiling and/or upside price targets decrease in value with the ceiling moving to a lower strike.
- Rolling of floors - Considered strong presumptive evidence of a bullish thesis playing out.
- Occurs when we see the downside floor and/or downside price targets decrease in value with the floor moving to a higher strike.

Hedge Nodes
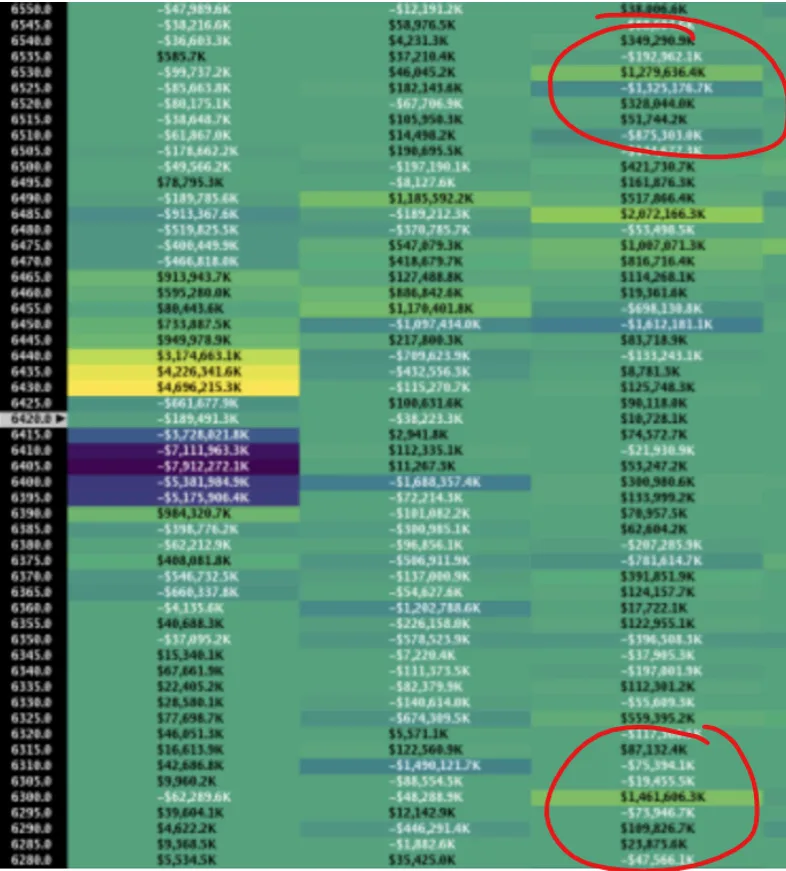
Hedge Nodes appear during major news or macro events — such as FOMC, CPI, JOLTS, NFP, or earnings.
They represent large, protective positions that sit farther from price and move slowly throughout the day.
Characteristics
- Typically static or slow-unwinding.
- Can appear above and below price simultaneously, typically far away from current spot price.
- Function like insurance rather than active magnets.
The closer a Hedge Node is to current price, the more it shapes intraday behavior.
The farther it is, the less influence it exerts.
Watch for gradual unwinds of large hedge nodes — they often signal changing Market Maker expectations.
Air Pockets
Air Pockets occur when maps show a zone of low volume and/or small sized nodes that price can move easily through due to the lack of resistance/activity within that zone.

- The quality of the nodes (negative gamma vs positive gamma) can affect how sharp a move price can have.
- If price action is moving through a negative gamma air pocket region, the moves can be much more violent / sharp.
- If price action is moving through a positive gamma air pocket region, the moves can be much more mild / slow.

Context matters - technical analysis and confluence among the other heatmaps (in trinity mode) can affect the ability for price to move through an air pocket.
- An air pocket does not mean price will move through it. It is one input to weigh alongside the other Trinity maps.
OPEX Nodes
Monthly options expire on the third Friday of the month. The week leading into it is OPEX Week.
What Happens During OPEX
- Nodes may carry less weight, since many contracts are set to expire.
- Positions roll off or reset, leading to temporary distortions in dealer positioning.
- After OPEX week passes, the map often becomes clearer.
Read OPEX week levels with caution: positioning is temporarily distorted.
In Summary:
- Focus on absolute value — not color or sign.
- Untouched nodes tend to matter more than retested ones.
- Rate of change gives clues on momentum.
- Midpoints are the least clear part of a range; gatekeepers and king nodes shape where price goes next.
- Be mindful of external catalysts like Power Hour, OPEX, and Hedge Nodes.
Last updated